Datasets
List of created datasets
Datasets
List of created datasets
Honeynet data 1
4.11.2024 – 3.4.2025
This dataset represents a comprehensive set of time-lapse records of network activity and cyberattacks captured using a distributed honeypot system from November 2024 to April 2025. The main goal of data collection was to monitor real-world threats in an uncontrolled network environment and analyze the behavior of botnets or individual attackers.
The dataset is structured into four main areas:
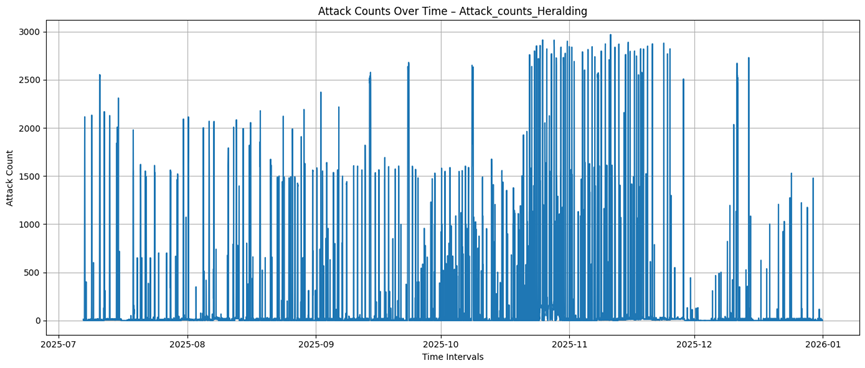
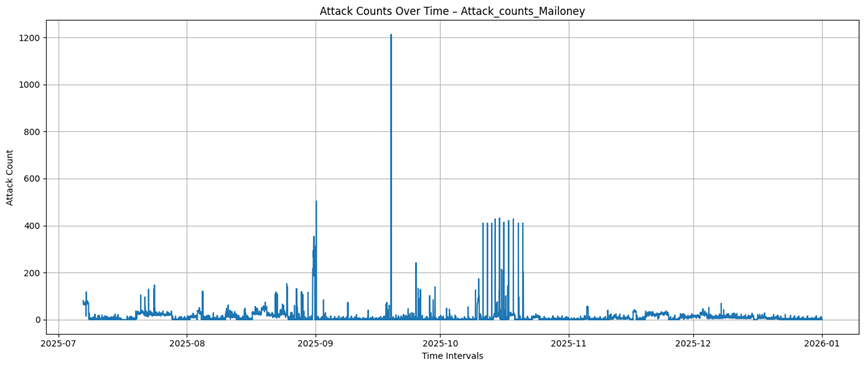
- Sensor Analysis: Data from six specialized honeypots (Cowrie, Dionaea, Heralding, Honeytrap, Tanner, Mailoney) emulating various vulnerable services.
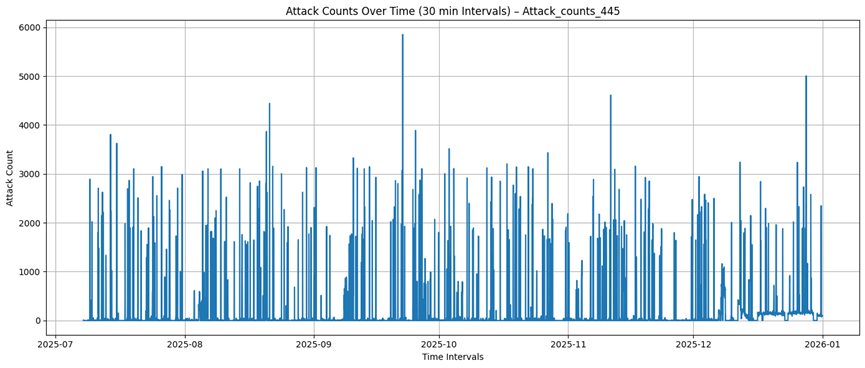
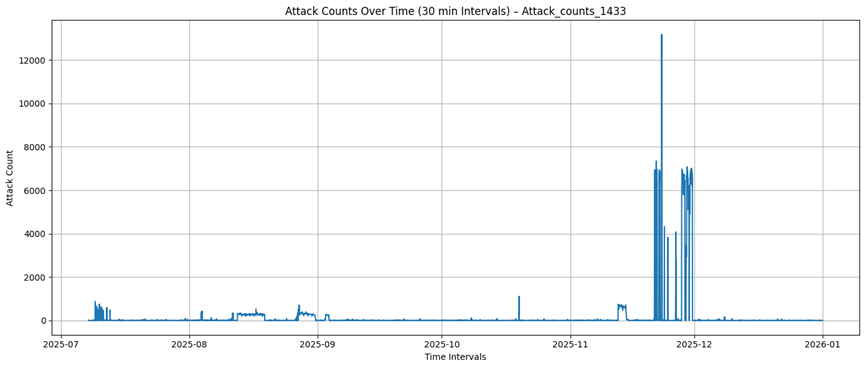
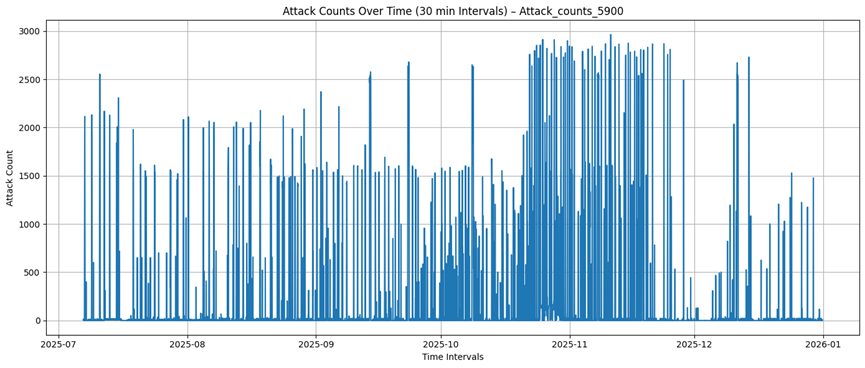
- Targeted Ports: Tracking the intensity of attacks on the most commonly abused network ports (22, 23, 445, 1433, 5900).
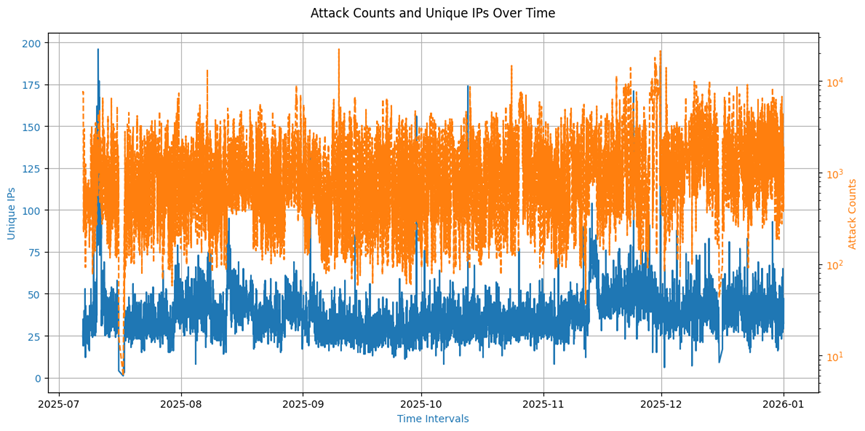
- Intensity and Uniqueness: Comparing the total volume of attacks with the number of unique source IP addresses, which allows us to distinguish between targeted attacks and distributed campaigns.
- Geographic Distribution: Mapping attacks to countries of origin to identify regional trends in cybercrime.
Data is pre-processed into 30-minute intervals, enabling efficient temporal analysis, anomaly detection, and training of machine learning models for intrusion detection (IDS).
More information
Honeypot Attacks
Dataset Information
Dataset Characteristics: Multidimensional
Domain: Cybersecurity
Flag Type: Date and Time, Integer
Number of Instances: 7248
Number of Flags: 7
Missing values: No
Time Range: 4.11.2024 – 3.4.2025
Data Source: Honeypots
Dataset Description
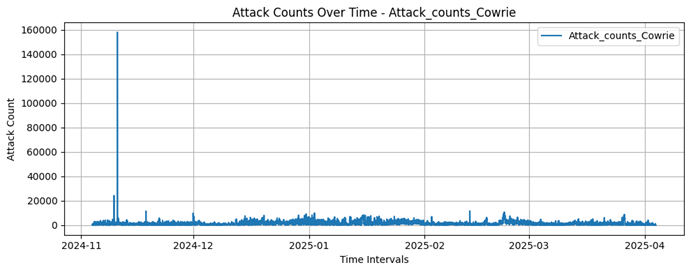
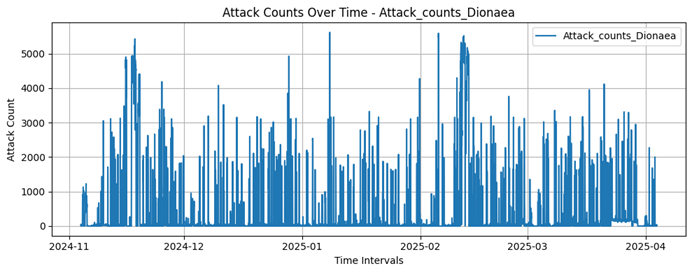
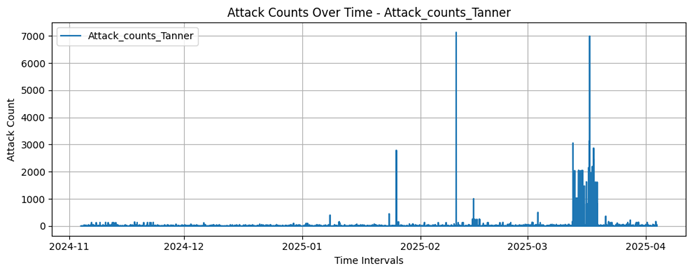
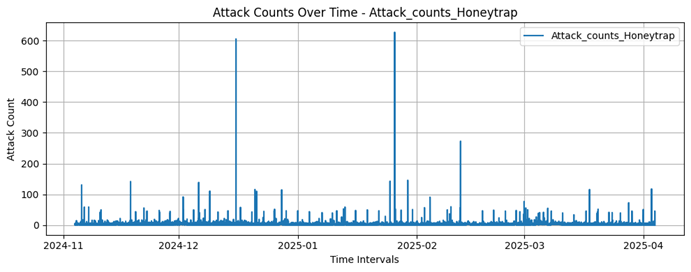
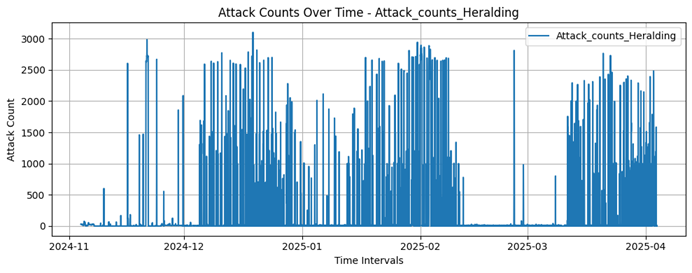
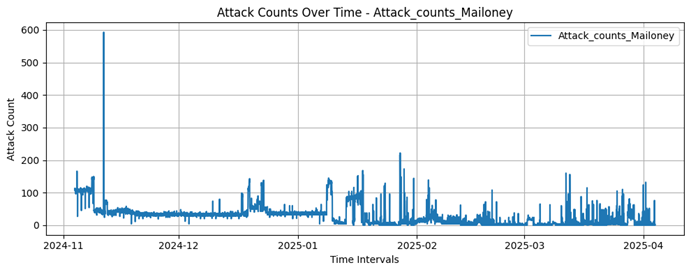
This dataset represents the number of attack attempts captured by various honeypot systems at different time intervals. Each row corresponds to a specific time period, and each flag records the number of attacks detected by a specific honeypot system.
Variables Table
| Variable name | Variable type | Missing data | Description |
|---|---|---|---|
|
Timestamp |
Date and time |
No |
Date and time of recording |
|
Attack_counts_Cowrie |
Integer |
No |
Number of attacks recorded by the Cowrie honeypot |
|
Attack_counts_Dionaea |
Integer |
No |
Number of attacks recorded by the Dionaea honeypot |
|
Attack_counts_Heralding |
Integer |
No |
Number of attacks recorded by the Heralding honeypot |
|
Attack_counts_Honeytrap |
Integer |
No |
Number of attacks recorded by the Honeytrap honeypot |
|
Attack_counts_Tanner |
Integer |
No |
Number of attacks recorded by the Tanner honeypot |
|
Attack_counts_Mailoney |
Integer |
No |
Number of attacks recorded by the Mailoney honeypot |
Statistics
| Attack_ counts_ Cowrie | Attack_ counts_ Dionaea | Attack_ counts_Heralding | Attack_ counts_ Honeytrap | Attack_ counts_ Tanner | Attack_ counts_ Mailoney | |
|---|---|---|---|---|---|---|
|
Count |
7248 |
7248 |
7248 |
7248 |
7248 |
7248 |
|
Average |
1514 |
306,8 |
144,01 |
3,9 |
29,11 |
27,52 |
|
Standard deviation |
2580 |
872,83 |
493,57 |
13,19 |
207,77 |
30,31 |
|
Minimal value |
9 |
O |
O |
O |
O |
O |
|
Maximal value |
158130 |
5617 |
3102 |
627 |
7130 |
593 |
Plots
Cowrie
Dionaea
Tanner
Honeytrap
Heralding
Mailoney
Attacks on Ports
Dataset Information
Dataset Characteristics: Multidimensional
Domain: Cybersecurity
Flag Type: Date and Time, Integer
Number of Instances: 7248
Number of Flags: 6
Missing values: No
Time Range: 4.11.2024 – 3.4.2025
Data Source: Honeypots
Dataset Description
This dataset contains time-lapse records of attack attempts captured by a honeypot monitoring system. Each row corresponds to a specific time period, and each flag represents the number of detected attacks on specific ports that are common targets for attackers.
Variables Table
| Variable name | Variable type | Missing data | Description |
|---|---|---|---|
|
Timestamp |
Date and time |
No |
Date and time of recording |
|
Attack_counts_22 |
Integer |
No |
Number of attacks on port 22 |
|
Attack_counts_23 |
Integer |
No |
Number of attacks on port 23 |
|
Attack_counts_445 |
Integer |
No |
Number of attacks on port 445 |
|
Attack_counts_1433 |
Integer |
No |
Number of attacks on port 1433 |
|
Attack_counts_5900 |
Integer |
No |
Number of attacks on port 5900 |
Statistics
| Attack_ counts_22 | Attack_ counts_23 | Attack_ counts_445 | Attack_ counts_1433 | Attack_ counts_5900 | |
|---|---|---|---|---|---|
|
Count |
7248 |
7248 |
7248 |
7248 |
7248 |
|
Average |
116.59 |
34.86 |
175.21 |
126.08 |
142.64 |
|
Standard deviation |
151.33 |
38.62 |
524.6 |
13,19 |
694.42 |
|
Minimal value |
1 |
O |
O |
O |
O |
|
Maximal value |
1670 |
868 |
5613 |
5579 |
3102 |
Plots
Target port 22

Target port 23

Target port 445

Target port 1433

Target port 5900

Number of all attacks and unique source IP addresses
Dataset Information
Dataset Characteristics: Multidimensional
Domain: Cybersecurity
Flag Type: Date and Time, Integer
Number of Instances: 7248
Number of Flags: 3
Missing values: No
Time Range: 4.11.2024 – 3.4.2025
Data Source: Honeypots
Dataset Description
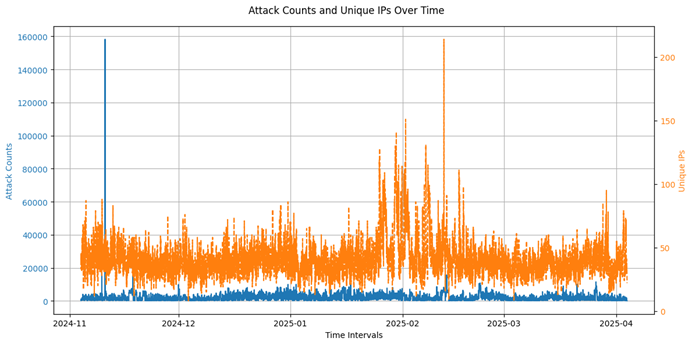
This dataset represents temporal data on the number of attacks and the number of unique IP addresses involved in attack attempts within specific time intervals.
Variables Table
| Variable name | Variable type | Missing data | Description |
|---|---|---|---|
|
Timestamp |
Date and time |
No |
Date and time of recording |
|
Attack_counts |
Integer |
No |
Number of attack attempts intercepted in a given time interval |
|
Unique_ips |
Integer |
No |
Number of unique IP addresses involved in attack attempts |
Statistics
| Attack_counts | Unique_ips | |
|---|---|---|
|
Count |
7248 |
7248 |
|
Average |
2037,65 |
40,37 |
|
Standard deviation |
2732,53 |
14.,6 |
|
Minimal value |
35 |
8 |
|
Maximal value |
158217 |
214 |
Plots
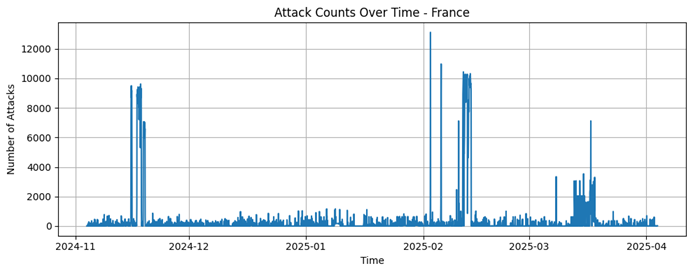
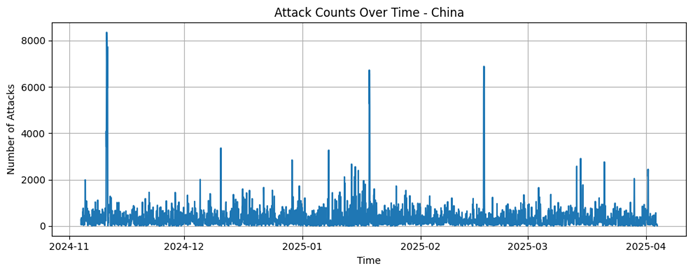
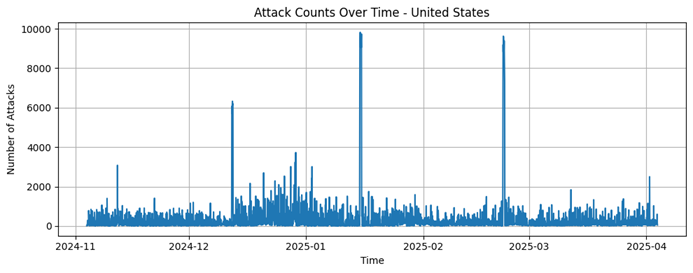
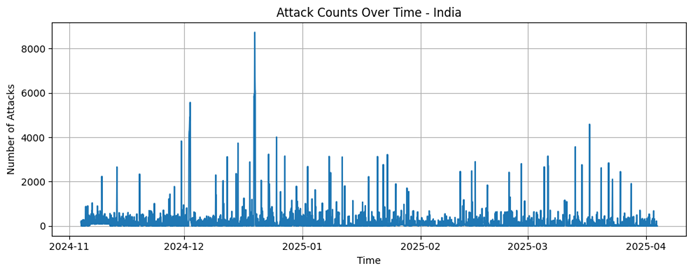
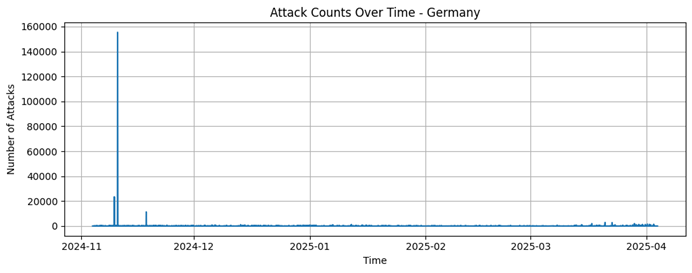
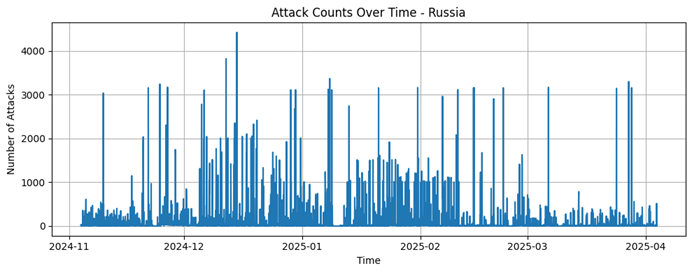
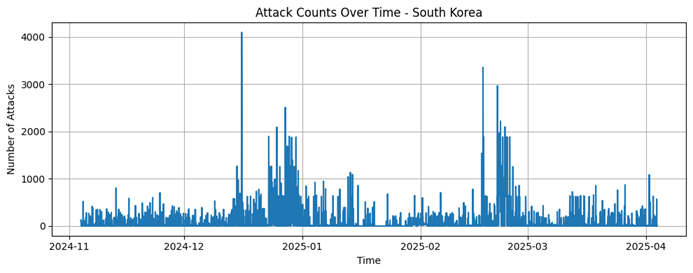
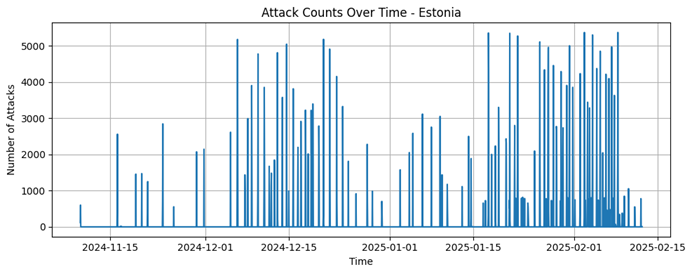
Number of attacks by country of origin
Dataset Information
Dataset Characteristics: Multidimensional
Domain: Cybersecurity
Flag Type: Date and time, Integer, Categorical
Number of Instances: 45577
Number of Flags: 3
Missing values: No
Time Range: 4.11.2024 – 3.4.2025
Data Source: Honeypots
Dataset Description
This dataset represents temporal data on the number of attacks and the number of unique IP addresses involved in attack attempts within specific time intervals.
Variables Table
| Variable name | Variable type | Missing data | Description |
|---|---|---|---|
|
Timestamp |
Date and time |
No |
Date and time of recording |
|
Attacks |
Integer |
No |
Number of attack attempts intercepted in a given time interval |
|
Country |
Categorical |
No |
Source country of attack |
Statistics
| Country | Count | Average | Standard deviation | Minimal value | Maximal value | Number of attacks by country |
|---|---|---|---|---|---|---|
|
China |
7213 |
162,83 |
303,2 |
1 |
4338 |
1174484 |
|
Estonia |
415 |
911,1 |
992,83 |
1 |
3102 |
378106 |
|
France |
3663 |
344,162 |
1002,54 |
1 |
7114 |
1260667 |
|
Germany |
4475 |
113,73 |
2734,02 |
1 |
155349 |
508930 |
|
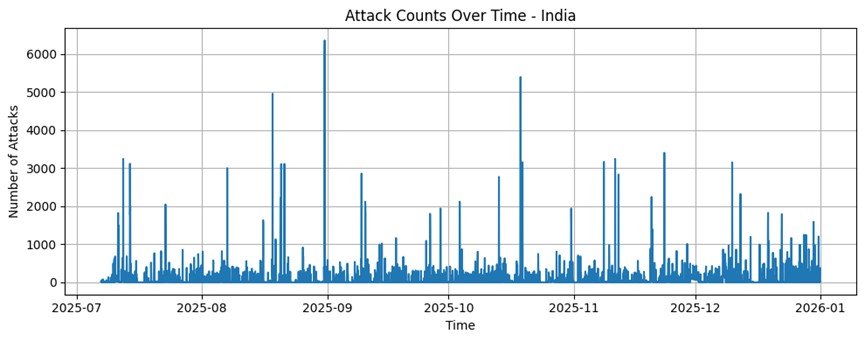
India |
6285 |
108,55 |
304,95 |
1 |
4575 |
682237 |
|
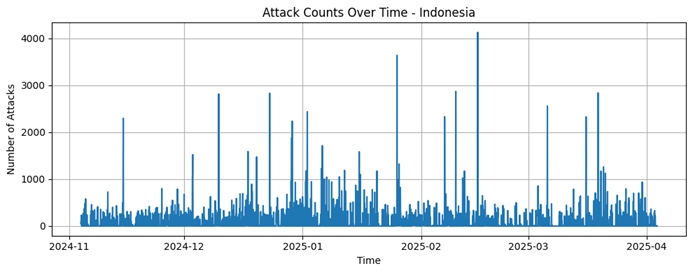
Indonesia |
2850 |
125,46 |
213,01 |
1 |
3031 |
357563 |
|
Russia |
5191 |
91,77 |
286,69 |
1 |
4417 |
476393 |
|
South Korea |
4046 |
99,6 |
219,45 |
1 |
2726 |
402975 |
|
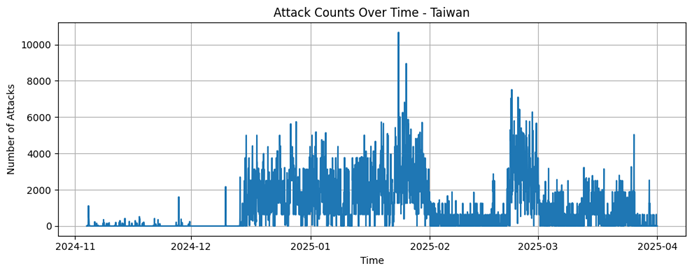
Taiwan |
4240 |
826,52 |
816,9 |
1 |
6289 |
3504450 |
|
United States |
7198 |
161,58 |
434,56 |
1 |
5190 |
1163085 |
Plots
Taiwan
France
China
United States
India
Germany
Russia
South Korea
Estonia
Indonesia
Honeynet data 2
1.7.2025 – 1.1.2026
This dataset represents a comprehensive set of time records of network activity and cyberattacks captured using a distributed honeypot system from July 2025 to January 2026. The main goal of data collection was to monitor real threats in an uncontrolled network environment and analyze the behavior of botnets or individual attackers.
The dataset is structured into four main areas:
- Sensor Analysis: Data from six specialized honeypots (Cowrie, Dionaea, Heralding, Honeytrap, Tanner, Mailoney) emulating various vulnerable services.
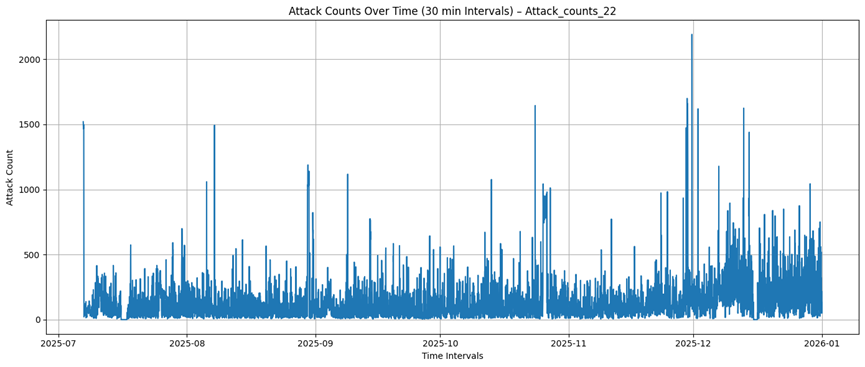
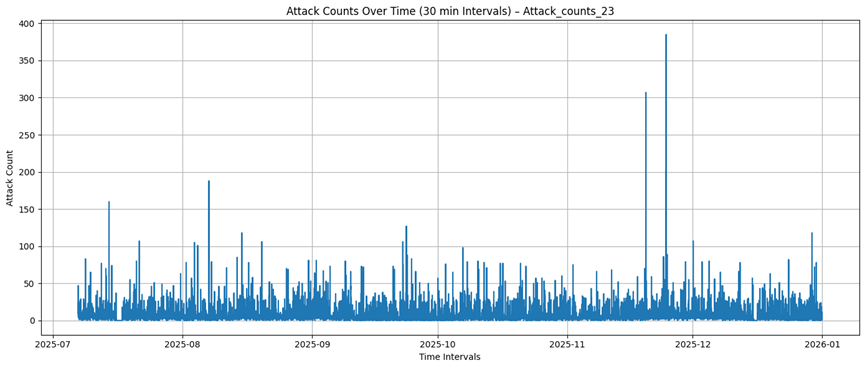
- Targeted Ports: Tracking the intensity of attacks on the most commonly abused network ports (22, 23, 445, 1433, 5900).
- Intensity and Uniqueness: Comparing the total volume of attacks with the number of unique source IP addresses, which allows us to distinguish between targeted attacks and distributed campaigns.
- Geographic Distribution: Mapping attacks to countries of origin to identify regional trends in cybercrime.
Data is pre-processed into 30-minute intervals, enabling efficient temporal analysis, anomaly detection, and training of machine learning models for intrusion detection (IDS).
More information
Honeypot Attacks
Dataset Information
Dataset Characteristics: Multidimensional
Domain: Cybersecurity
Flag Type: Date and Time, Integer
Number of Instances: 7248
Number of Flags: 7
Missing values: No
Time Range: 1.7.2025 – 1.1.2026
Data Source: Honeypots
Dataset Description
This dataset represents the number of attack attempts captured by various honeypot systems at different time intervals. Each row corresponds to a specific time period, and each flag records the number of attacks detected by a specific honeypot system.
Variables Table
| Variable name | Variable type | Missing data | Description |
|---|---|---|---|
|
Timestamp |
Date and time |
No |
Date and time of recording |
|
Attack_counts_Cowrie |
Integer |
No |
Number of attacks recorded by the Cowrie honeypot |
|
Attack_counts_Dionaea |
Integer |
No |
Number of attacks recorded by the Dionaea honeypot |
|
Attack_counts_Heralding |
Integer |
No |
Number of attacks recorded by the Heralding honeypot |
|
Attack_counts_Honeytrap |
Integer |
No |
Number of attacks recorded by the Honeytrap honeypot |
|
Attack_counts_Tanner |
Integer |
No |
Number of attacks recorded by the Tanner honeypot |
|
Attack_counts_Mailoney |
Integer |
No |
Number of attacks recorded by the Mailoney honeypot |
Statistics
| Attack_ counts_ Cowrie | Attack_ counts_ Dionaea | Attack_ counts_Heralding | Attack_ counts_ Honeytrap | Attack_ counts_ Tanner | Attack_ counts_ Mailoney | |
|---|---|---|---|---|---|---|
|
Count |
8544 |
8511 |
8540 |
8544 |
8544 |
8544 |
|
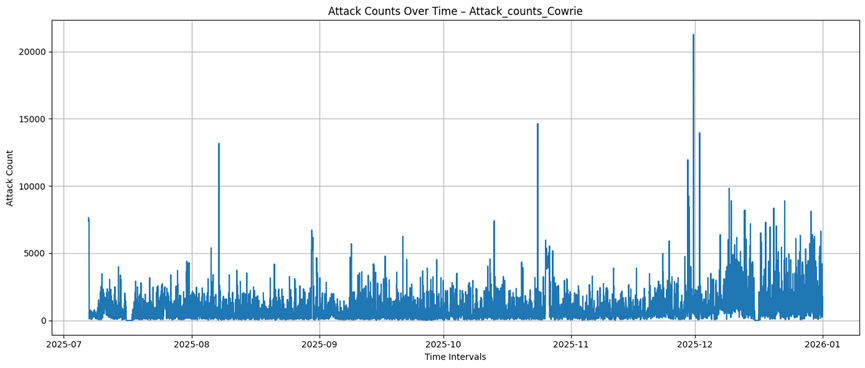
Average |
868,14 |
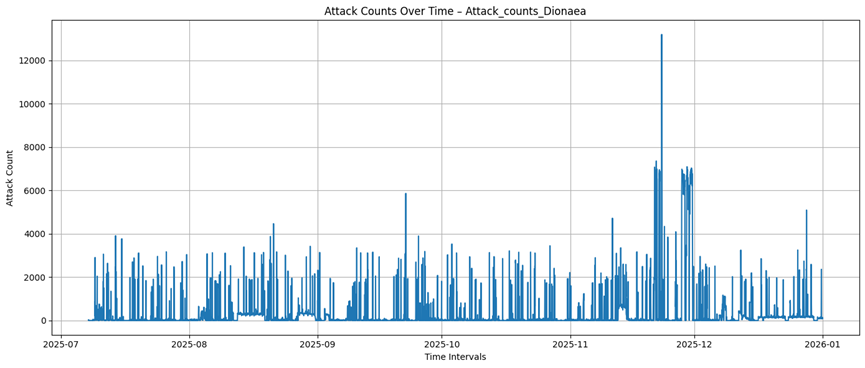
298,11 |
163,30 |
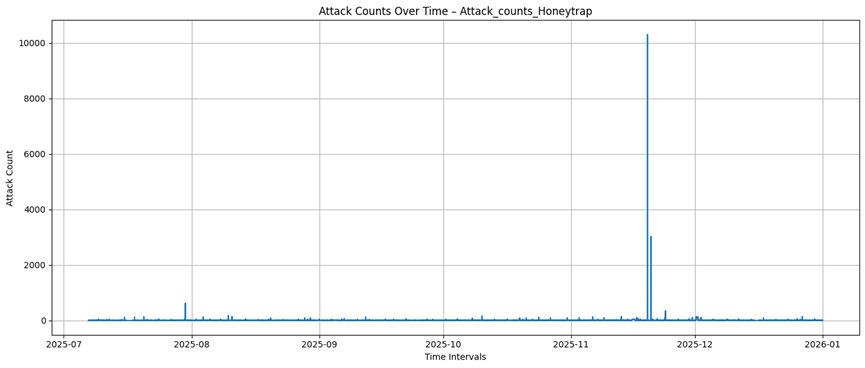
8,04 |
13,23 |
10,46 |
|
Standard deviation |
1052,86 |
974,82 |
503,52 |
142,98 |
245,35 |
29,25 |
|
Minimal value |
O |
O |
O |
O |
O |
O |
|
Maximal value |
21265 |
13186 |
2970 |
10306 |
18608 |
1213 |
Plots
Cowrie
Dionaea
Tanner

Honeytrap
Heralding
Mailoney
Attacks on Ports
Dataset Information
Dataset Characteristics: Multidimensional
Domain: Cybersecurity
Flag Type: Date and Time, Integer
Number of Instances: 7248
Number of Flags: 6
Missing values: No
Time Range: 1.7.2025 – 1.1.2026
Data Source: Honeypots
Dataset Description
This dataset contains time-lapse records of attack attempts captured by a honeypot monitoring system. Each row corresponds to a specific time period, and each flag represents the number of detected attacks on specific ports that are common targets for attackers.
Variables Table
| Variable name | Variable type | Missing data | Description |
|---|---|---|---|
|
Timestamp |
Date and time |
No |
Date and time of recording |
|
Attack_counts_22 |
Integer |
No |
Number of attacks on port 22 |
|
Attack_counts_23 |
Integer |
No |
Number of attacks on port 23 |
|
Attack_counts_445 |
Integer |
No |
Number of attacks on port 445 |
|
Attack_counts_1433 |
Integer |
No |
Number of attacks on port 1433 |
|
Attack_counts_5900 |
Integer |
No |
Number of attacks on port 5900 |
Statistics
| Attack_ counts_22 | Attack_ counts_23 | Attack_ counts_445 | Attack_ counts_1433 | Attack_ counts_5900 | |
|---|---|---|---|---|---|
|
Count |
8544 |
8544 |
8511 |
8511 |
8538 |
|
Average |
128,37 |
7,63 |
138,38 |
152,05 |
161,06 |
|
Standard deviation |
156,24 |
12,41 |
458,15 |
877,51 |
503,35 |
|
Minimal value |
O |
O |
O |
O |
O |
|
Maximal value |
2191 |
385 |
5854 |
13178 |
2965 |
Plots
Target port 22
Target port 23
Target port 445
Target port 1433
Target port 5900
Number of all attacks and unique source IP addresses
Dataset Information
Dataset Characteristics: Multidimensional
Domain: Cybersecurity
Flag Type: Date and Time, Integer
Number of Instances: 7248
Number of Flags: 3
Missing values: No
Time Range: 1.7.2025 – 1.1.2026
Data Source: Honeypots
Dataset Description
This dataset represents temporal data on the number of attacks and the number of unique IP addresses involved in attack attempts within specific time intervals.
Variables Table
| Variable name | Variable type | Missing data | Description |
|---|---|---|---|
|
Timestamp |
Date and time |
No |
Date and time of recording |
|
Attack_counts |
Integer |
No |
Number of attack attempts intercepted in a given time interval |
|
Unique_ips |
Integer |
No |
Number of unique IP addresses involved in attack attempts |
Statistics
| Attack_counts | Unique_ips | |
|---|---|---|
|
Count |
8436 |
8436 |
|
Average |
1391,58 |
37,93 |
|
Standard deviation |
1586,18 |
14,23 |
|
Minimal value |
6 |
1 |
|
Maximal value |
22309 |
196 |
Plots
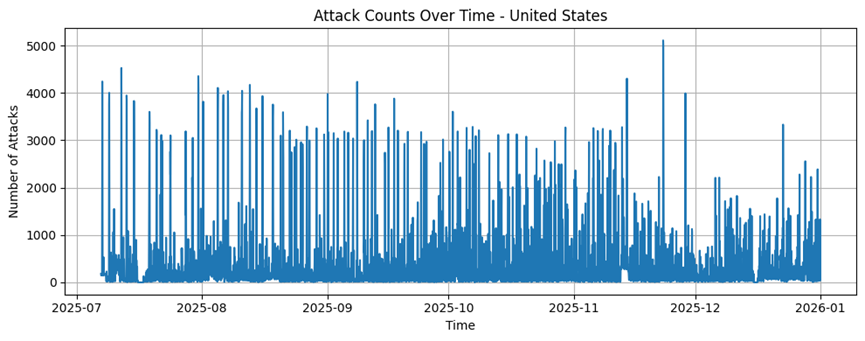
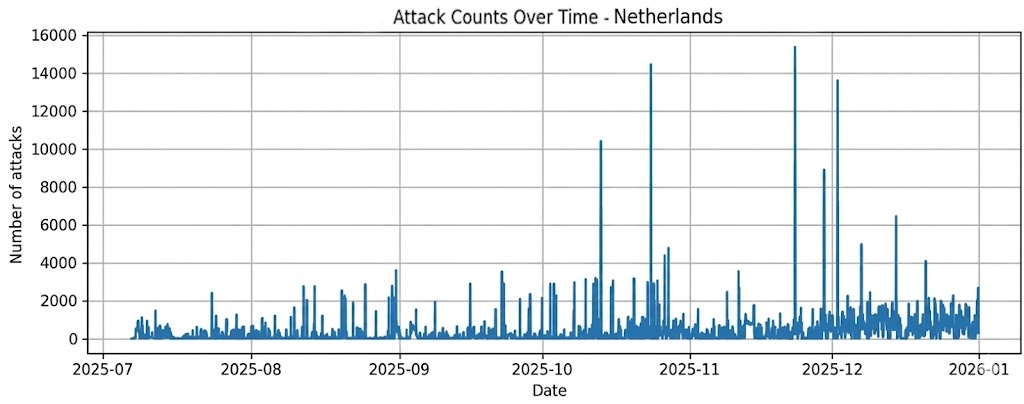
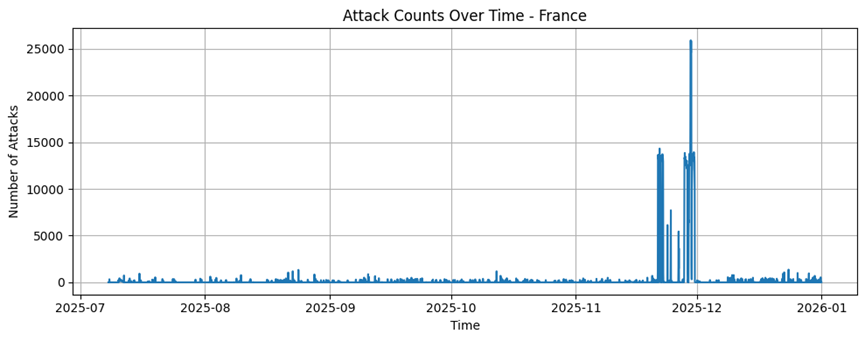
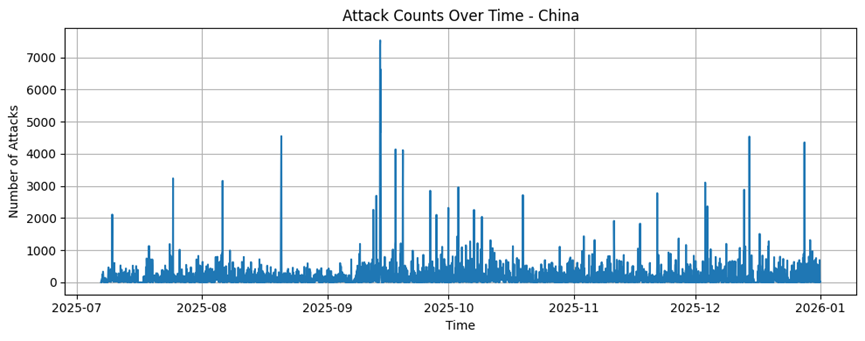
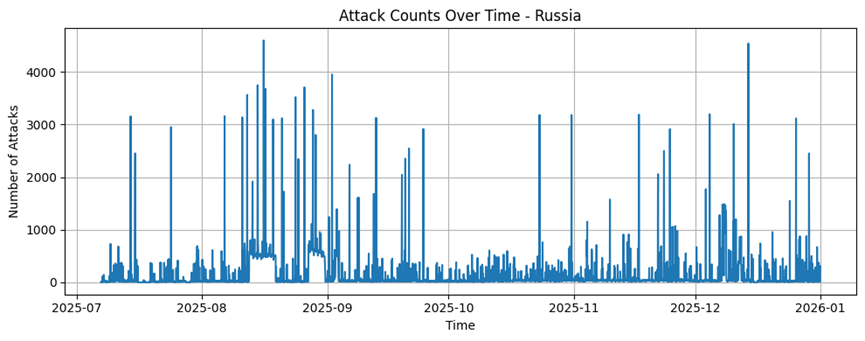
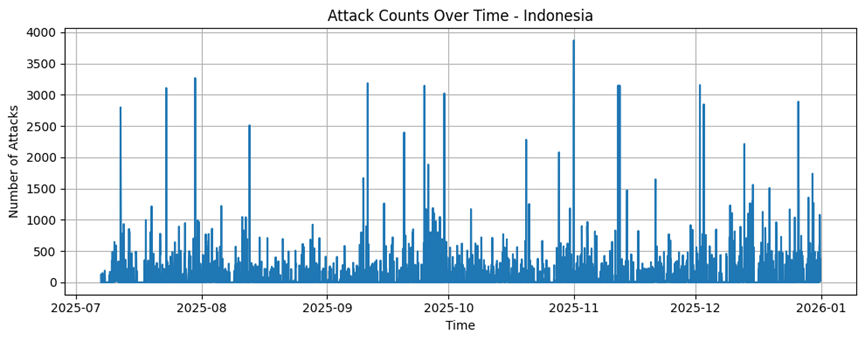
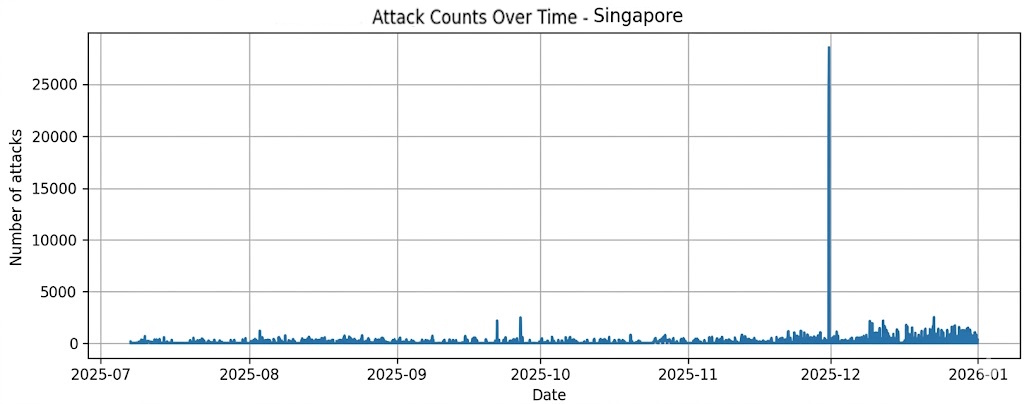
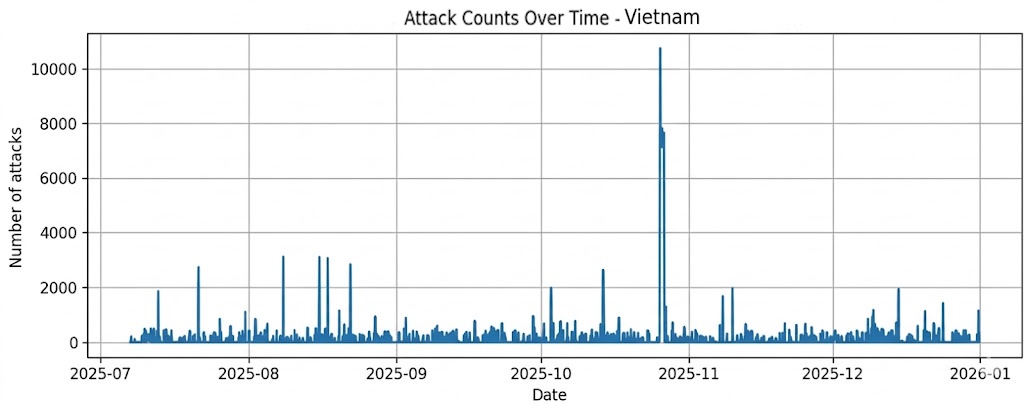
Number of attacks by country of origin
Dataset Information
Dataset Characteristics: Multidimensional
Domain: Cybersecurity
Flag Type: Date and time, Integer, Categorical
Number of Instances: 45577
Number of Flags: 3
Missing values: No
Time Range: 1.7.2025 – 1.1.2026
Data Source: Honeypots
Dataset Description
This dataset represents temporal data on the number of attacks and the number of unique IP addresses involved in attack attempts within specific time intervals.
Variables Table
| Variable name | Variable type | Missing data | Description |
|---|---|---|---|
|
Timestamp |
Date and time |
No |
Date and time of recording |
|
Attacks |
Integer |
No |
Number of attack attempts intercepted in a given time interval |
|
Country |
Categorical |
No |
Source country of attack |
Statistics
| Country | Count | Average | Standard deviation | Minimal value | Maximal value | Number of attacks by country |
|---|---|---|---|---|---|---|
|
China |
7494 |
101,15 |
231,51 |
1 |
3815 |
758055 |
|
France |
2930 |
396,01 |
1553.62 |
1 |
13370 |
1160298 |
|
Germany |
6378 |
61,39 |
298,09 |
1 |
8102 |
391570 |
|
India |
4588 |
90.97 |
249,00 |
1 |
3492 |
472175 |
|
Indonesia |
3809 |
123,96 |
223,39 |
1 |
2853 |
472175 |
|
Russia |
7996 |
72,42 |
213,02 |
1 |
3170 |
579038 |
|
Singapur |
3555 |
120,79 |
384,38 |
1 |
14970 |
429419 |
|
Holandsko |
7771 |
169,06 |
425.26 |
1 |
14437 |
1313752 |
|
United States |
8396 |
182,52 |
367,48 |
1 |
3781 |
1532402 |
|
Vietnam |
2880 |
146,88 |
495,56 |
1 |
5690 |
423002 |
Plots
United States
Holandsko
France
China
Russia
Indonesia
Singapur
Vietnam
India
Time series dataset for network security situational awareness
2017-2018, 2022-2024
This dataset is a large-scale time series in the field of network security intended for research and prediction of situational awareness (Network Security Situational Awareness – NSSA). It contains aggregated numbers of security events in 1-minute intervals (and derived 30-minute periods) for defined criteria, with the data available in CSV format and as serialized Pandas DataFrame objects.
The data source is the Warden system, which serves to share information about detected cyber incidents. The dataset covers two long-term time periods (2017–2018 and 2022–2024) and is based on data collected from real sensors mainly in the Czech Republic, operated by the CESNET organization.
The main added value of the dataset is its realism and the length of the monitored period, which allows capturing the dynamics of cyber threats, attack patterns and attacker behavior in a real environment. Unlike commonly used datasets, such as UNSW-NB15, CSE-CIC-IDS2018 or CIC-IDS2017, which are often synthetic or time-limited, this dataset provides long-term and authentic data suitable for advanced analytical tasks.
More information
Time series dataset for network security situational awareness
Dataset Information
Domain: Computer science
Specific subject area: Network security situation awareness forecasting using time series data.
Data type: Time series tabular data (CSV files and Pandas Dataframe pickled files) containing counts of security events in 1-minute intervals for selected criteria.
Data collection: The source of data was Warden system [1,2]. It is a system for efficient sharing of information about detected cybersecurity events. We obtained data from Warden from two periods. First from between 11th December 2017 and 9th December 2018 and second is from 31st December 2022 to 31st December 2024. Based on 21 specified criteria and selected sensors in Warden system we created multiple time series with periods of 30 minutes and 1 minute.
Data source location The Warden system is operated by the CESNET organization in the Czech Republic. Most of the detection systems contributing data to Warden are located in the Czech Republic as well.
Data accessibility Repository name: Mendeley Data – Time series dataset for network security situational awareness
Data identification number:
Direct link to the data.
Related research article P. Sokol, R. Staňa, A. Gajdoš, a P. Pekarčík, „Network security situation awareness forecasting based on statistical approach and neural networks,“ Logic Journal of the IGPL, roč. 31, č. 2, s. 352–374, 2023, Link [3].
Value of the Data
The dataset represents a realistic view of organizational network security situational awareness (NSSA), as it contains alerts collected from real and operational network sensors. Many existing datasets like UNSW-NB15 [4], CSE-CIC-IDS2018 [5], CIC-IDS2017 [6] or others, that are mainly created for classification task in field of intrusion detection, are outdated, contains data created in simulated environments and only in short period of time (in hours or days) are not suitable for NSSA This dataset was created from various network sensors placed in real network environment over extended period of time (one year and two years). This allows it to be more suitable for NSSA by capturing attack patterns, adversary behaviour, and evolving security threats. It provides a valuable resource for understanding the challenges in the field of cybersecurity.
This dataset is publicly available and composed of real-world data. Most previous research in organizational network situational awareness has relied on private data or datasets created through simulated infrastructure attacks (synthetic datasets) [4]. These datasets are often not publicly available due to privacy concerns or the presence of sensitive information. By publishing a large, open dataset, we enable reproducible research and objective comparisons of methods across various areas of situational awareness (e.g., threat detection or forecasting).
The dataset combines alerts from diverse and geographically distributed sensors (across the Czech Republic), which were targeted by attacks from around the world. This enables the study of large-scale, coordinated attacks, the analysis of temporal and spatial relationships between alerts, and the evaluation of collaborative intrusion detection techniques in multi-domain environments.
The dataset is suitable for various analytical approaches, including forecasting, anomaly detection, machine learning, and statistical analysis. Researchers can test and refine their predictive models, correlation methods, and detection algorithms using real-world data. This supports both fundamental research and practical development.
Background
An important aspect of research in the area of Network Security Situation Awareness (NSSA) is the ability to create a suitable dataset for comparing data analysis and machine learning methods for NSSA, particularly in the areas of understanding and prediction. Generally, there are very few datasets suitable for this type of research. Datasets designed for intrusion detection are often used in place of these. While this is a closely related topic, such data may not fully align with the specific challenges of NSSA. These datasets are typically artificially generated and do not reflect the real situational context within organizations.
From this perspective, it is essential to work with a dataset that captures real-world attacks. Moreover, it is beneficial to have data from diverse sources that are geographically distributed and collected using multiple types of collectors. This type of data was used in the paper [3].
In our study, we focused on NSSA forecasting based on neural network approaches and statistical methods. Most existing research focuses on the overall number of attacks [7] or events [8] within NSSA. These data enable us to explore individual components of NSSA, such as attack categories, services, and protocols.
Data Description
The dataset consists of processed alerts collected from the Warden system over several months (2017-2018 and 2023-2024). In total, more than three billion alerts were gathered from intrusion detection systems, honeypots, and other data sources deployed in organizations across the Czech Republic.
Since the data are obtained from detection mechanisms (silver-standard labels), they should be treated as labelled but not manually verified (e.g., by an expert). This fact needs to be taken into account when interpreting the results derived from this dataset. A similar dataset was created in 2020. The dataset contained raw alerts covering one week [9].
Due to the different periods of data collection as well as specific conditions related to the collection of real-world data, the dataset is divided into four parts:
• Part 1 - time series of IDEA alerts collected from the WARDEN system between 2017 and 2018,
• Part 2 - modified time series of IDEA alerts from
• Part 3 - cleared time series of IDEA alerts from part 2,
• Part 4 - time series of IDEA alerts collected from the WARDEN system between 2023 and 2024.
For the first part of the dataset, we selected 21 criteria for creating time series. The first two time series contain, per each time interval:
- count of all alerts,
- count of unique source IP addresses.
The other time series contains counts of alerts of a specific category and of those with a specific target port or protocol, namely:
- category Recon.Scanning - attacks that send requests to a system in order to discover vulnerabilities. This also includes various testing processes to gather information about devices, running processes, users, etc.,
- category Availability.DDoS - the system is flooded with a large number of requests (packets, connections) from multiple sources, causing delays in operation or system crashes.
- category Attempt.Login - multiple login attempts (e.g., brute force),
- category Attempt.Exploit - an attempt to compromise a system or disrupt a service by exploiting vulnerabilities with a standardized identifier, such as CVE (e.g., buffer overflow, cross-site scripting, etc.), CVE (napr. buffer overflow, cross-site scripting a pod.),
- category Malware.Ransomware - software intentionally inserted or executed in a system with the malicious purpose of encrypting files and demanding ransom,
- category Intrusion.Botnet – detection of command-and-control (C&C) communication with a controlling server,
- port 21,
- port 22,
- port 23,
- port 25,
- port 80,
- port 443,
- port 445,
- protocol TCP,
- protocol SSH,
- protocol UDP,
- protocol ICMP,
- protocol MS WBT Server,
- protocol telnet.
This part of dataset is in folder named “part1”. There is one compressed csv file - part1.csv.xzThis file contains 22 columns. The first one is timestamptimestampand the other columns are values corresponding to specified criterion.
Every value means how many events occurred for selected criterion in given period (30 minutes). There are 17,473 rows (values) in the time range from 11th December 2017 00:00 to 10th December 2018 00:00. There are two places in dataset with missing values (value is NaN – not a number). First one is between 31st October 2018 00:00 (row 15,552) and 31st October 2018 23:30 (row 15,599), and at the end of dataset from 9th December 2018 20:00 (row 17464). In total 57 values are missing. Fig. 1 shows a part of the dataset for criterions “Count of all alerts”, “Category attempt login”, and “Port 445”.
Additionally, we provide a Jupyter Notebook (read_part_1.ipynb) in directory part1that demonstrates data loading, display graphs, shows more statistical information, train end test split according to papers [3,22] etc.
For the first part of the dataset, we also provide jupyter notebook (prediction_example_part_1.ipynbthat show example of usage of one time series (Port 445) of this part of the dataset for forecasting, using LSTM network and ARIMA approach. This example is easy to adjust to be used on other time series and other parts of the dataset.
The second part of the dataset has the same structure as the first part. This part of the dataset is in a folder named ''part2''. There is one compressed CSV file – part2.csv.xz. This part of the dataset consists of 520,889 rows (values). The period for this part of the dataset is one minute. Problematic and missing data from the beginning and end of the time series were removed, and the first value is on 13th December 2017 at 00:00. The last on 9th December 2018 at 17:28.
Also, there are missing data (NaN) between 31st October 2018 at 00:00 and 31st October 2018 23:30 (1411 rows). We also provide an example Jupyter Notebook (read_part_2.ipynb) in the folder “part 2” that demonstrates data loading, changing periods, displaying graphs, and showing additional statistical information, train end test split according to papers [3,22], among other features.
The third part of the dataset consists of three processing outputs (folders “only_events”, “source_destination”, and “tables_csv” in the “part3” folder).
Each of the first two processing outputs (folders “only_events” and “source_destination”) consists of 20 compressed CSV files. The name of each file corresponds to one of the 20 criteria described in the first part (note that one criterion does not have a time series). Every file contains columns that correspond to sensors that were sending alerts to the Warden system.
There are 271 time series in total (271 is the sum of the number of columns in every criterion file) in each of the first two processing outputs. The period is again one minute, so every line describes how many alerts are sent by the given sensor in one minute. The number of columns can vary because not every sensor sends alerts for every criterion.
The files in processing outputs vary in the way they were created. More information can be found in section “Experimental design, materials and methods”. The time range of the time series is the same as in the second part of the dataset, with the same missing values.
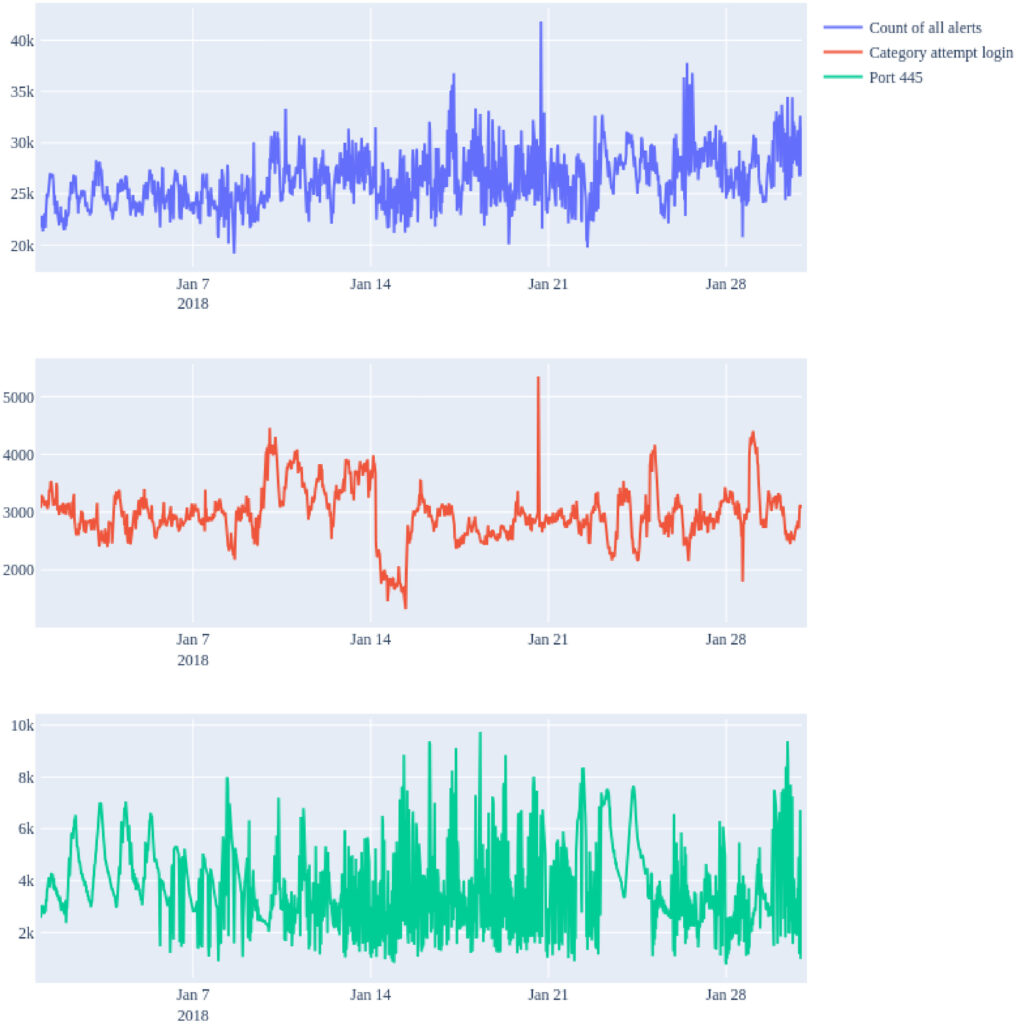
Fig 1. Sample plot of the dataset for criterions count of all alerts, category attempt login and Port 445 between 2018-1-1 00:00 and 2018-1-31 00:00.
In the third processing output (folder “tables_csv”), we provide a compressed CSV file for each day (364 in total). Each file consists of processed alerts that occurred on that day. Every line has information about the event time, sensor, number of connections, number of source IP addresses, and all categories, ports, and protocols we described at the beginning of the processing output.
We also provide a Jupyter Notebook (read_part_3.ipynb) in folder “part 3”, as in the previous parts that also demonstrate combining time series from different sensors.
To provide more information about used sensors, we added files sensors_statistics.csv.xz and sensors_statistics.ipynbthat described used sensors in more detail. The CSV file contains information about all number of alerts in every minute of provided time interval for every used sensor. The jupyter notebook display csv file and provide basic information. The NaN value means that there are no alerts from sensor at the time.
The fourth part of the dataset addresses the need for data in this field. The structure of the dataset is the same as the third part of the dataset, with three processing outputs, and with a Jupyter notebook provided in the folder “part4”. The first value is on 31st December 2022 at 23:00 and the last on 31st December 2024 at 22:59.
In both of the first two processing outputs (folders “only_events” and “source_destination”), there are 20 compressed CSV files with 253 time series. There is more missing data in various places (13 in total), affecting a total of 20,116 rows with NaN values out of a total of 1,052,640 rows.
In the third processing output are 731 compressed CSV files with the same structure as in third part.
In this part, we also provide a Jupyter Notebook (read_part_4.ipynb) in directory part4that demonstrates data loading, display graphs, shows more statistical information, combining time series from different sensors, train (80%) end test (20%) splits, with recommendation to use walk-forward validation walk forward validation on train part. For this part files sensors_statistics.csv.xz and sensors_statistics.ipynb.
Key aspects (basic information) of all parts and processing of proposed dataset are summarized in Table 1 The integrity of all provided files can be checked by MD5 and SHA256 hash files.
Table 1
The comparison of all parts and processings of dataset.
| Part | Time span | Processing | Number of time series/files | Values in time series | Minimal time unit | Missing data |
|---|---|---|---|---|---|---|
|
1 |
11th December 2017 - 10th December 2018 |
original data used in research [3,22] |
21 - one time series per criterion |
17 473 |
30 min |
31st October 2018 00:00 - 31st October 2018 23:30 and 9th December 2018 20:00 - end (57 rows) |
|
2 |
11th December 2017 - 10th December 2018 |
original data with repaired timestamp |
21 - one time series per criterion |
520 889 |
1 min |
31st October 2018 at 00:00 and 31st October 2018 23:30 (1411 rows) |
|
3 |
11th December 2017 - 10th December 2018 |
1st - Alert-based time series (only_events) |
271 time series with different number of every of 20 criterions |
520 889 |
1 min |
31st October 2018 at 00:00 and 31st October 2018 23:30 (1411 rows) |
|
|
|
2nd - IP-pair-basedtime series (source-destination) |
271 time series with different number of every of 20 criterions |
520 889 |
1 min |
31st October 2018 at 00:00 and 31st October 2018 23:30 (1411 rows) |
|
|
|
3rd - Tabular representation (table_csv) |
364 - one file per day |
– |
– |
31st October 2018 at 00:00 and 31st October 2018 23:30 |
|
4 |
31st December 2022 - 31st December 2024 |
1st - Alert-based time series (only_events) |
253 time series with different number of every of 20 criterions |
1 052 640 |
1 min |
13 places in time series (20,116 rows) |
|
|
|
2nd - IP-pair-basedtime series (source-destination) |
253 time series with different number of every of 20 criterions |
1 052 640 |
1 min |
13 places in time series (20,116 rows) |
|
|
|
3rd - Tabular representation (table_csv) |
731 - one file per day |
– |
– |
13 places |
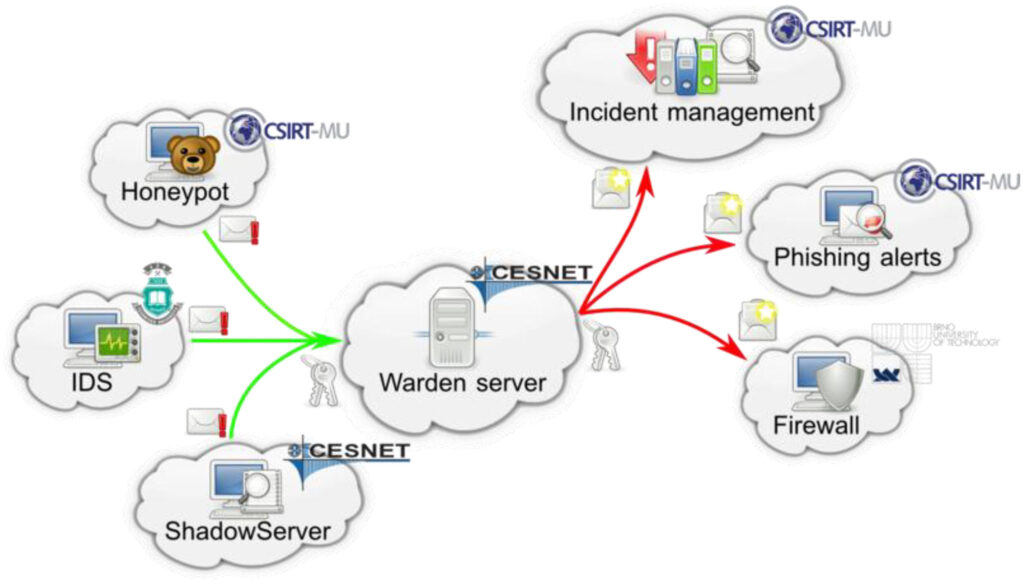
Fig. 2. Architecture of warden system, sending clients (on left), and receiving clients (on right). Source: [2].
Experimental Design, Materials and Methods
This section is divided into three subsections. First, we describe the Warden systemalert sharing platform, from which the data were collected. Next, we present the collected security events. Finally, we provide a detailed explanation of the data preprocessing and the creation of time series.
WARDEN Platform
The data were collected for the period of several months (2017-2018 and 2023-2024), in the alert sharing platform called Warden system [1,2] that allows sharing intrusion detection alerts between organizations. This system receives alerts sent by various intrusion detection systems, honeypots, and third-party sharing platform (sending clients), and distributed them to various recipients, such as analytical tools, reporting tools, and active network defence devices (receiving clients). The schema of the Warden platform is available in Fig. 2.
Sensors deployed within the Czech academic network CESNET organizationincluding campus networks and connected commercial ISP networks send data to the Warden platform. These networks are geographically distributed across the entire territory of the Czech Republic. The sensors mainly consist of intrusion detection systems and honeypots. The most significant system is the network-based intrusion detection system NEMEA [10], which detects port scans, brute-force attacks, DDoS attacks, DDoS amplifiers, communication with IP addresses on blacklists, and network traffic anomalies.
In addition, other network-based intrusion detection systems (e.g., Suricata [11]) and anomaly detection systems (e.g., Network traffic monitoring – FTAS [12]) are also deployed, although they generate a smaller number of alerts. Various honeypots are also deployed within this academic network, such as Cowrie [13], Dionaea [14], Hugo [15], LaBrea [16] and others. The honeypots record network scans, brute-force attacks, and exploitation attempts.
Collected Data (Security Alerts)
Platform Warden system collects alerts from sending clients and storing (sharing) them in format IDEA [17]. IDEA format is a descriptive data model using a key-value JSON structure, that contains several mandatory fields (format, ID, detect time, category) and many optional fields with multiple input support2. An example of security event stored in IDEA format is shown in Fig. 3.
The IDEA format is inspired by the IDMEF (Intrusion Detection Message Exchange Format) [18]. IDEA uses the JSON format, whereas IDMEF uses XML. Unlike IDMEF, the IDEA format is extensible and includes an alert classification based on taxonomies from the CSIRT community [17]. In IDMEF, there is a Classification element, but it is not standardized and can contain any arbitrary text string.
The time fields in IDEA follow RFC 3339 [19], whereas IDMEF uses ISO 8601 standards. While IDMEF requires a timestamp of the start of an event, IDEA requires a timestamp of its detection for practical reasons. It is often difficult to determine or estimate the start of an event, especially when detecting network traffic anomalies or large-scale incidents [20].
If necessary, conversion from IDMEF to IDEA is relatively straightforward. Inputs can be further validated using the IDEA data format [21].
The alerts for creating the dataset were collected by the client application in the time period between 11th December 2017 00:00 and 10th December 2018 00:01 for the first three parts of the dataset and between 31st December 2022 23:00 and 31st December 2024 23:00 for the fourth part.
The alerts (data) were stored in files, one file per day, with each line containing one alert in IDEA format. The total number of collected alerts was approximately three billion.
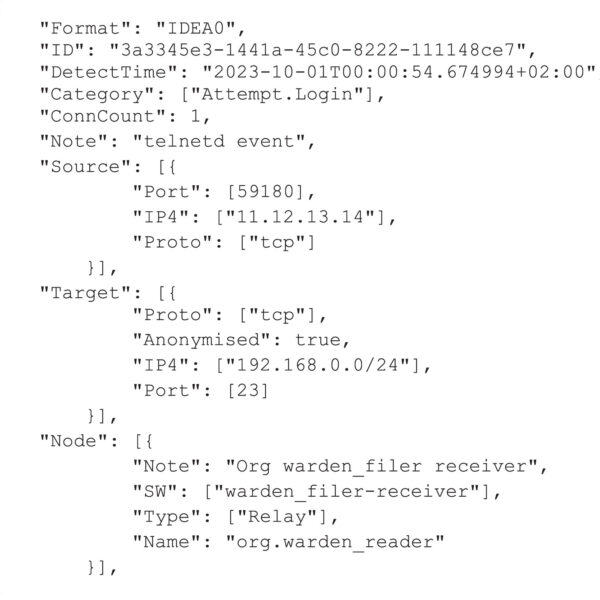
Fig. 3. Example of an alert in IDEA format.
After collecting data from Warden system , we created time series based on the criteria described in the chapter DATA DESCRIPTION. Individual attributes were created from alerts in the IDEA format according to the following rules:
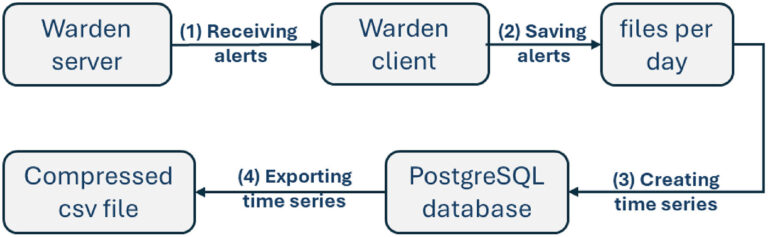
Fig. 4. Workflow of creating the first part of dataset.
- In the case of Count of all alerts, we count all alerts that occurred within a given time period.
- The Count of unique IPs criterion takes into account all different ``Source'', ``IP4'' addresses within a given time period.
- In the case of Category recon scanning and other Category criteria, ``Category'' was an important key in IDEA. IDEA.
- Port 21 and other Port criteria take into account the ``Port'' key in the ``Target'' key.
- Protocol TCP and other protocol criteria were created from the ``Proto'' key in the ``Target'' key.
- For the first part of dataset time series were created and stored with a 30-minutes time period based on the ''Detection time''. In case of the second, the third, and fourth part of dataset time series were created and stored with a one-minute time period based on the ''Detection time''.
As mentioned in the previous chapter, the dataset consists of four parts. The process of creating the first part of the dataset is illustrated in Fig. 4. sensors (honeypots, IDS, ShadowServer) deployed within the CESNET network send alerts to the Warden server, which forwards them to our receiving client (Figs. 4–1).
The client collects alerts in real-time and stores them into daily files (one file per day) (Figs. 4–2). Time series are then created from these files and stored in a PostgreSQL database (Figs. 4, 3). Using database queries, time series with a 30-minute interval (as used in papers [3,22]) are generated (Fig. 4). Example of database query:
SELECT time_bucket(‘30 min’, “time”) AS “time”, sum(value) AS “value” FROM history_int
WHERE “time” BETWEEN ‘2017-12-11’ AND ‘2018-12-11’ AND item_id = 70
GROUP BY 1 ORDER BY 1;
The history_int table stores the number of alerts per minute, and item_id is a code representing the criterion (e.g., 70 corresponds to port 443). This process results in a compressed CSV file containing 22 columns: one for the timestamp and twenty-one for the corresponding criteria. The result is a compressed CSV file containing one column with a timestamp and twenty-one columns corresponding to the selected criteria (Fig. 4).
There are two problems with this part of the dataset. These data represent real operational data associated with specific application-related issues. The first problem is related to Warden data processing. In the process of reading timestamps from alerts, the time zone was not taken into account. This problem is only minor because only 1.31% of alerts have timestamps with time zones other than UTC.
The second problem is related to alerts generation. When sensor is added to Warden system, it can be in test operational state. Sometimes it can be in test state for long time even if it is used in production. In this case 26.31% of alerts in this part of dataset were in test operational state. Although some alerts are labelled as test, they are real alerts that occur in the organization. Real operation also involves testing available solutions, which is appropriate to take into account when designing systems for real operation. We believe that it can be helpful for community of researchers in this area so they can train and test their methods and compare their results with results in papers [3,22].
The problem with timestamp stated in previous text, we solved in the second part of dataset. The solution is changing every record timestamp to UTC. Flow of the second part of dataset creation is shown in Fig. 5. First, daily files containing alerts are processed. Python scripts with the multiprocessing library are used to generate 21 individual time series (each representing a specific criterion), with a time period of one minute for every day (source file).
During processing, timestamps are converted to UTC and time series are created (Figs. 5–1). All generated time series are then merged into a single Pandas DataFrame object. Finally, the DataFrame is exported and stored as a compressed CSV file (Figs. 5, 2).
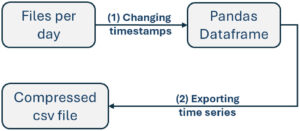
Fig. 5. Workflow of creating second part of dataset.
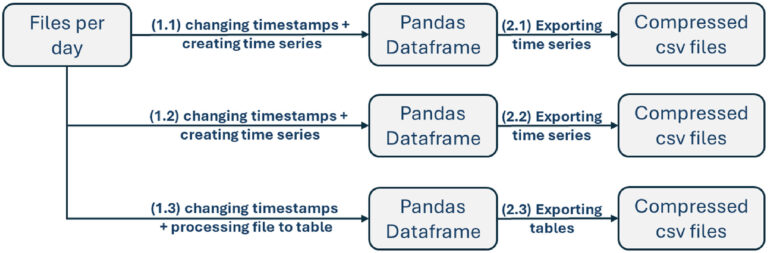
For the third and fourth parts of dataset , the creation of dataset is shown in Fig. 6. Daily files containing alerts are processed in three different ways, depending on the intended type of time series:
Tretie The 1st processing - Alert-based time series (only_events) - The timestamps in each file are converted to UTC, and time series are created where each alert contributes a value of one (Fig. 6 – 1.1). These time series are aggregated into a Pandas DataFrame and exported as compressed CSV files (Fig. 6 – 2.1).
The 2nd processing - IP-pair-basedtime series (source-destination) - The timestamps are converted to UTC, and time series are created where each alert contributes a value equal to the product of the number of unique source IP addresses and the number of unique destination IP addresses per alert (Fig. 6 – 1.2). The resulting time series are aggregated into a Pandas DataFrame and exported as compressed CSV files (Fig. 6 – 2.2).
The 3rd processing - Tabular representation (table_csv) - After converting timestamps to UTC, each file is processed into a structured table format (Fig. 6 – 1.3) and exported as compressed CSV files (Fig. 6 – 2.3).
Obr. 6. Pracovný postup vytvorenia tretej a štvrtej časti súboru údajov.
For the third part of this dataset, the same files were used as in the second part. The first described issue was addressed in the same way as in the second part. To solve the second issue all sensors in normal state were used. On the other hand, all sensors in test state were consulted with Warden system administrator and only selected sensors were used.
This part of the dataset consists of 271 time series. For example, there are six time series (for sensors s06, s07, s15, s25, s31, and s33) for the Category attempt exploit. They were created using the same 21 criteria employed in the first and second parts, and we utilized them to generate a time series based on production and the selected test sensors. Sensors were excluded based on the knowledge of the Warden system administrator.
Due to the removal of some sensors that were in the test state, the category Malware.Ransomware has no alerts, and therefore, there is no time series for this category.
We created two sets of time series. The first one (folder source_destination) considers multiple source IP addresses and destination IP addresses within a single event. These two numbers were multiplied and then added to the corresponding time into time series. The second one (folder only_events) adds only value one to the corresponding time in the time series for every event.
There are two sets of 20 compressed CSV files, each containing 2×271 time series. The time series in this part have a period of 1 minute.
Additionally, we have processed every file with events in IDEA format to tabular form. These tables are stored in the 'only_events' folder as 363 compressed CSV files. Every line in every table represents a single processed event. We extract all important information from the IDEA stored event and create the corresponding columns as described in the “DATA DESCRIPTION”. This way, it is possible to aggregate data arbitrarily, according to research needs.
For creating the fourth part of the dataset , newer data from Warden were used. The workflow for creating this part of dataset is identical to that for the third part. Test sensors in newer data were again consulted with the Warden system administrator.
Two sets of 253 time series are stored in two sets of 20 compressed CSV files (note that category 'malware ransomware' has no alerts), and all events were processed into 731 compressed CSV files.
Limitations
Several limitations are associated with the created dataset:
- The data are collected only from sensors geographically located in the Czech Republic. For this reason, they should be used with this context in mind, and the results cannot be interpreted as generally applicable. The dataset is best suited for comparing methods for network situational awareness prediction.
- The data are obtained from detection mechanisms (labels represent a silver standard, not gold standard). Such labels should be understood as annotated, but not manually verified (e.g., by an expert). This fact must be taken into account when interpreting results derived from this dataset. At the same time, it is necessary to consider that since the data are generated and labelled by detection mechanisms, false positives (benign activity incorrectly labelled as malicious) or false negatives (malicious activity incorrectly labelled as benign) may occur. Moreover, some portions of certain attacks may not be captured at all.
- It is important to note that the presented dataset was not created for the purpose of classifying security alerts, but rather for predicting their occurrence. When selecting machine learning methods as well as interpreting the results, this aspect must be taken into account.
- There are missing data in the dataset:
◦ Missing data between 11th December 2017 and 10th December 2018, 1411 rows with NaN values out of a total of 520889 (0,27%):
▪31st October 2018 00:00 - 31st October 2018 23:30
▪9th December 2018 20:00 – 10th December 2018 00:00 (end of the dataset, removed in part 2 and 3)
◦ Missing data between 31st December 2022 and 31st December 2024, 20,116 rows with NaN values out of a total of 1,052,640 rows (1,91%):
▪
7th February 2023 22:59 - 8th February 2023 22:58
▪
18th February1502023 22:59 - 19th February 2023 22:58
▪
30th November 2023 23:59 - 31th November 2023 22:59
▪
12th December 2023 23:59 - 13th December 2023 22:57
▪
19th December 2023 22:59 - 20th December 2023 22:59
▪
22th December 2023 22:58 - 23th December 2023 22:57
▪
25th December 2023 22:57 - 27th December 2023 22:57
▪
30th December 2023 22:59 - 31th December 2023 22:59
▪
5th January 2024 22:58 - 6th January 2024 22:59
▪
9th January 2024 22:58 - 10th January 2024 22:58
▪
3th April 2024 21:58 - 4th April 2024 21:59
▪
6th April 2024 20:56 - 7th April 2024 22:01
▪
10th April 2024 21:59 - 11th April 2024 22:00