Datasets
List of created datasets
Honeynet data 1
4.11.2024 – 3.4.2025
text
More information
Honeypot Attacks
Dataset Information
Dataset Characteristics: Multidimensional
Domain: Cybersecurity
Flag Type: Date and Time, Integer
Number of Instances: 7248
Number of Flags: 7
Missing values: No
Time Range: 4.11.2024 – 3.4.2025
Data Source: Honeypots
Dataset Description
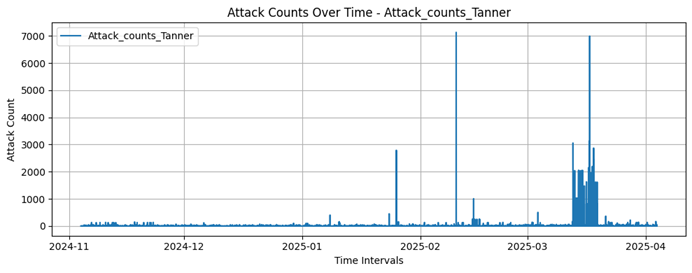
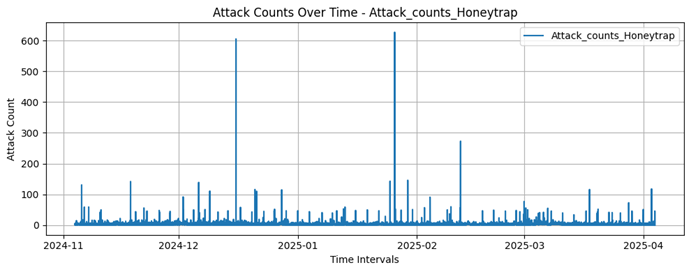
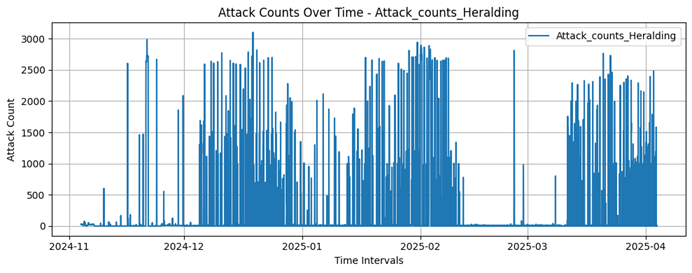
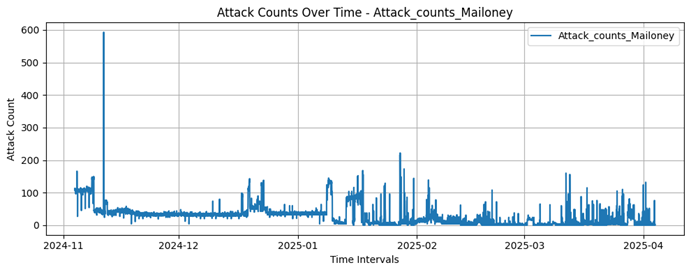
This dataset represents the number of attack attempts captured by various honeypot systems at different time intervals. Each row corresponds to a specific time period, and each flag records the number of attacks detected by a specific honeypot system.
Variables Table
| Variable name | Variable type | Missing data | Description |
|---|---|---|---|
|
Timestamp |
Date and time |
No |
Date and time of recording |
|
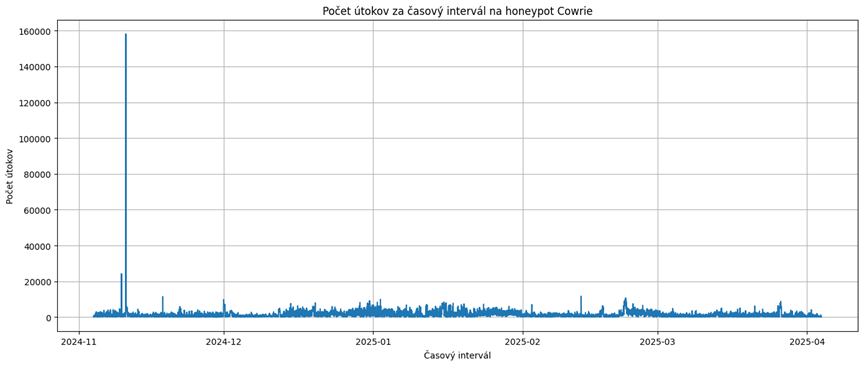
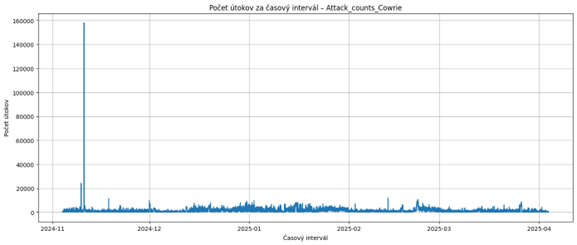
Attack_counts_Cowrie |
Integer |
No |
Number of attacks recorded by the Cowrie honeypot |
|
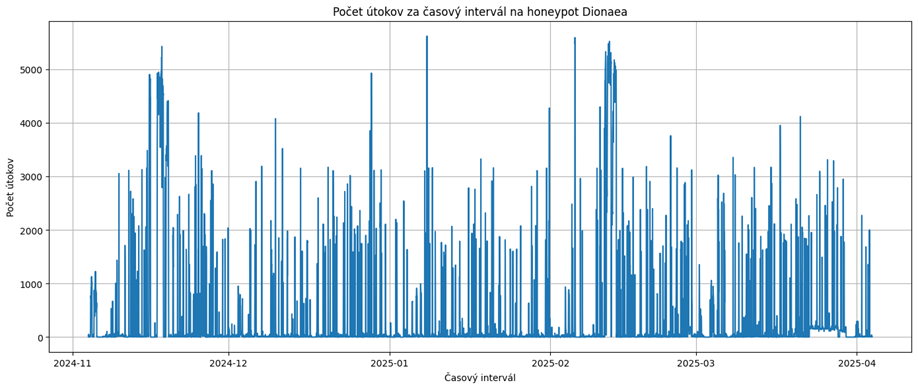
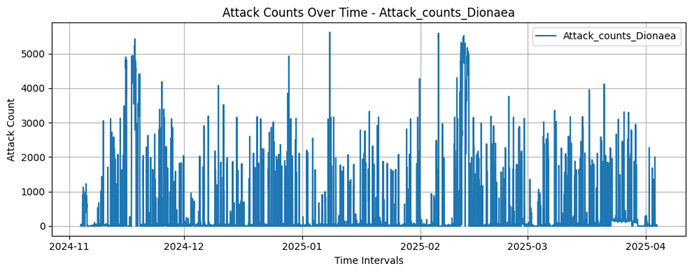
Attack_counts_Dionaea |
Integer |
No |
Number of attacks recorded by the Dionaea honeypot |
|
Attack_counts_Heralding |
Integer |
No |
Number of attacks recorded by the Heralding honeypot |
|
Attack_counts_Honeytrap |
Integer |
No |
Number of attacks recorded by the Honeytrap honeypot |
|
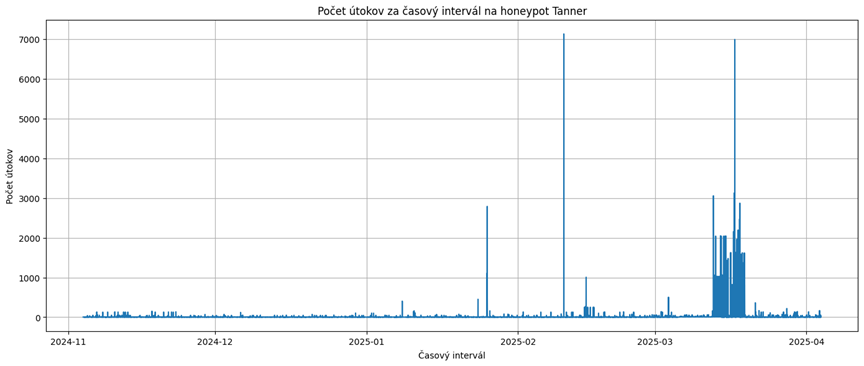
Attack_counts_Tanner |
Integer |
No |
Number of attacks recorded by the Tanner honeypot |
|
Attack_counts_Mailoney |
Integer |
No |
Number of attacks recorded by the Mailoney honeypot |
Statistics
| Attack_ counts_ Cowrie | Attack_ counts_ Dionaea | Attack_ counts_Heralding | Attack_ counts_ Honeytrap | Attack_ counts_ Tanner | Attack_ counts_ Mailoney | |
|---|---|---|---|---|---|---|
|
Count |
7248 |
7248 |
7248 |
7248 |
7248 |
7248 |
|
Average |
1514 |
306,8 |
144,01 |
3,9 |
29,11 |
27,52 |
|
Standard deviation |
2580 |
872,83 |
493,57 |
13,19 |
207,77 |
30,31 |
|
Minimal value |
9 |
O |
O |
O |
O |
O |
|
Maximal value |
158130 |
5617 |
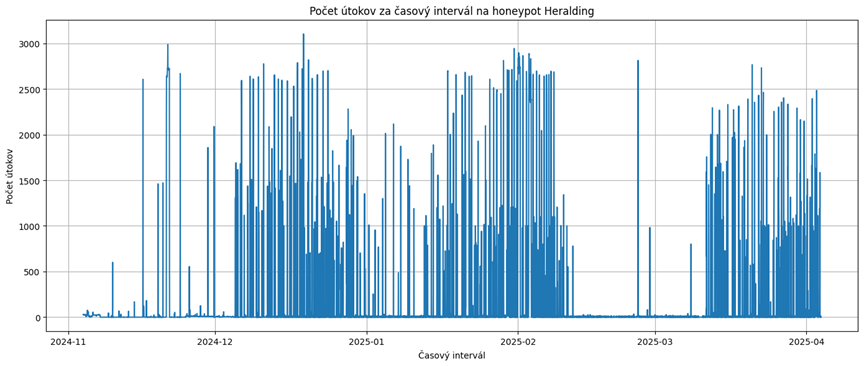
3102 |
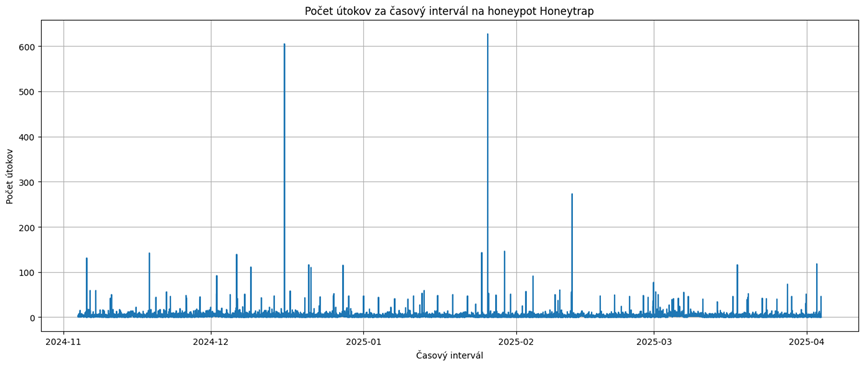
627 |
7130 |
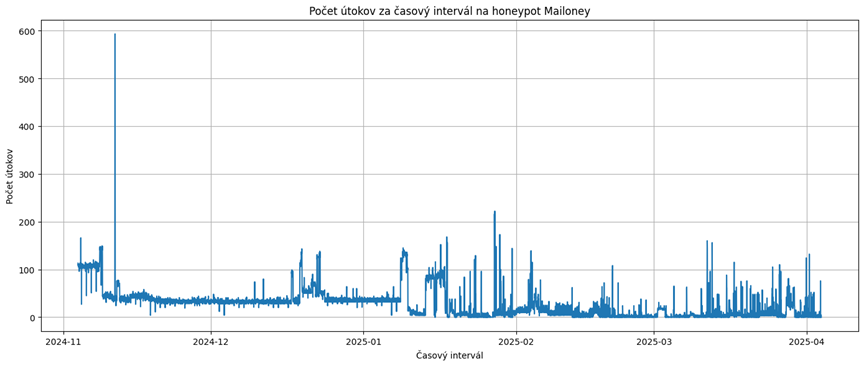
593 |
Plots
Cowrie
Dionaea
Tanner
Honeytrap
Heralding
Mailoney
Attacks on Ports
Dataset Information
Dataset Characteristics: Multidimensional
Domain: Cybersecurity
Flag Type: Date and Time, Integer
Number of Instances: 7248
Number of Flags: 6
Missing values: No
Time Range: 4.11.2024 – 3.4.2025
Data Source: Honeypots
Dataset Description
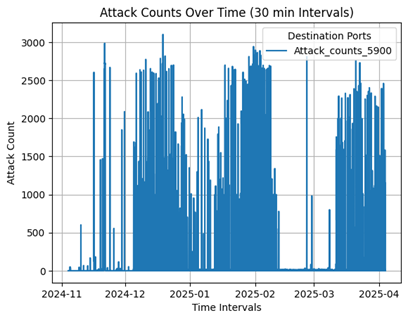
This dataset contains time-lapse records of attack attempts captured by a honeypot monitoring system. Each row corresponds to a specific time period, and each flag represents the number of detected attacks on specific ports that are common targets for attackers.
Variables Table
| Variable name | Variable type | Missing data | Description |
|---|---|---|---|
|
Timestamp |
Date and time |
No |
Date and time of recording |
|
Attack_counts_22 |
Integer |
No |
Number of attacks on port 22 |
|
Attack_counts_23 |
Integer |
No |
Number of attacks on port 23 |
|
Attack_counts_445 |
Integer |
No |
Number of attacks on port 445 |
|
Attack_counts_1433 |
Integer |
No |
Number of attacks on port 1433 |
|
Attack_counts_5900 |
Integer |
No |
Number of attacks on port 5900 |
Statistics
| Attack_ counts_22 | Attack_ counts_23 | Attack_ counts_445 | Attack_ counts_1433 | Attack_ counts_5900 | |
|---|---|---|---|---|---|
|
Count |
7248 |
7248 |
7248 |
7248 |
7248 |
|
Average |
116.59 |
34.86 |
175.21 |
126.08 |
142.64 |
|
Standard deviation |
151.33 |
38.62 |
524.6 |
13,19 |
694.42 |
|
Minimal value |
1 |
O |
O |
O |
O |
|
Maximal value |
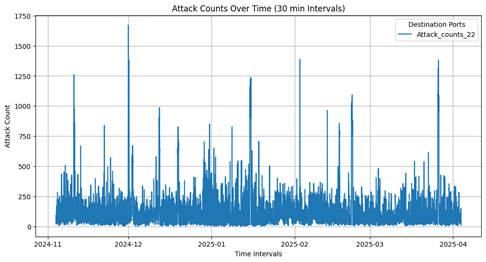
1670 |
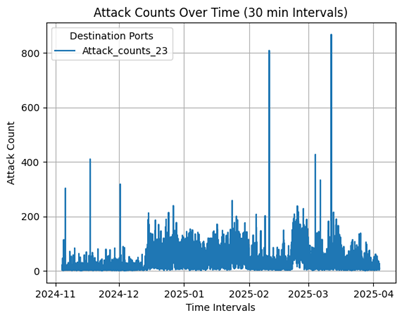
868 |
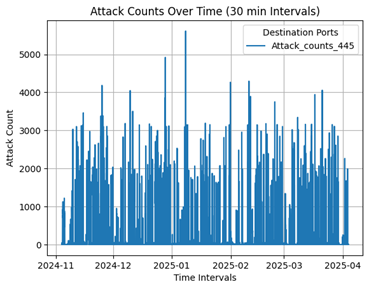
5613 |
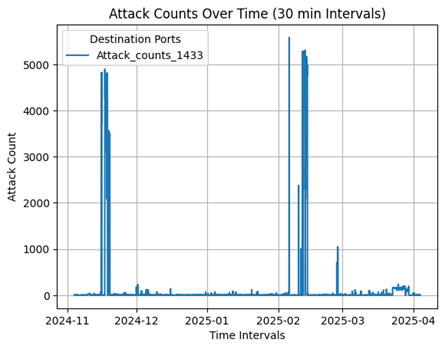
5579 |
3102 |
Plots
Target port 22
Target port 23
Target port 445
Target port 1433
Target port 5900
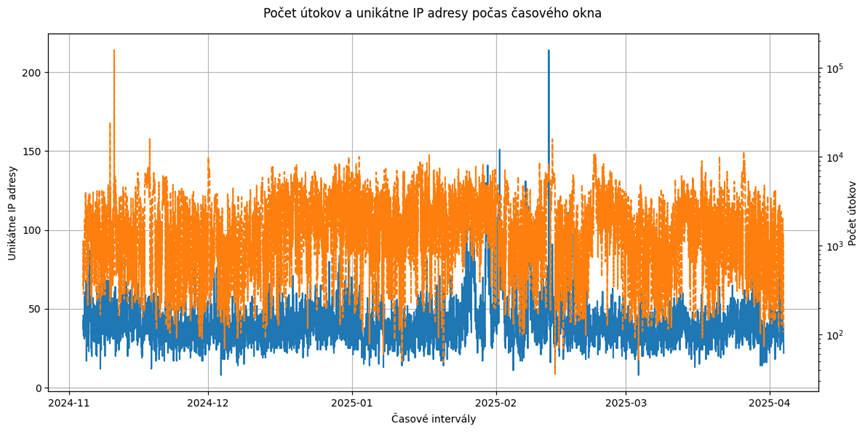
Number of all attacks and unique source IP addresses
Dataset Information
Dataset Characteristics: Multidimensional
Domain: Cybersecurity
Flag Type: Date and Time, Integer
Number of Instances: 7248
Number of Flags: 3
Missing values: No
Time Range: 4.11.2024 – 3.4.2025
Data Source: Honeypots
Dataset Description
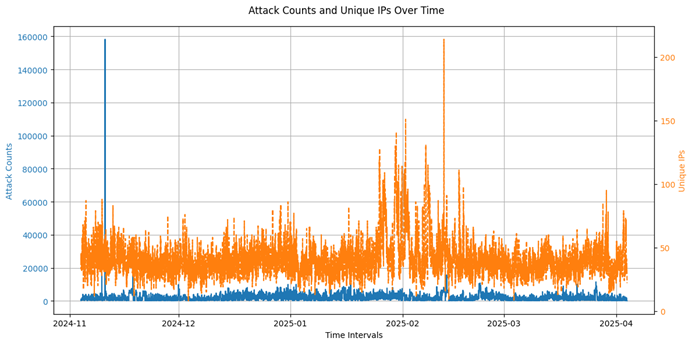
This dataset represents temporal data on the number of attacks and the number of unique IP addresses involved in attack attempts within specific time intervals.
Variables Table
| Variable name | Variable type | Missing data | Description |
|---|---|---|---|
|
Timestamp |
Date and time |
No |
Date and time of recording |
|
Attack_counts |
Integer |
No |
Number of attack attempts intercepted in a given time interval |
|
Unique_ips |
Integer |
No |
Number of unique IP addresses involved in attack attempts |
Statistics
| Attack_counts | Unique_ips | |
|---|---|---|
|
Count |
7248 |
7248 |
|
Average |
2037,65 |
40,37 |
|
Standard deviation |
2732,53 |
14.,6 |
|
Minimal value |
35 |
8 |
|
Maximal value |
158217 |
214 |
Plots
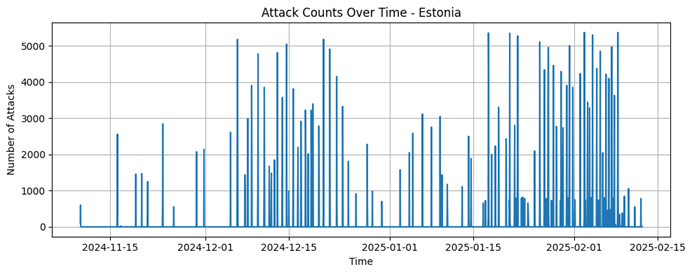
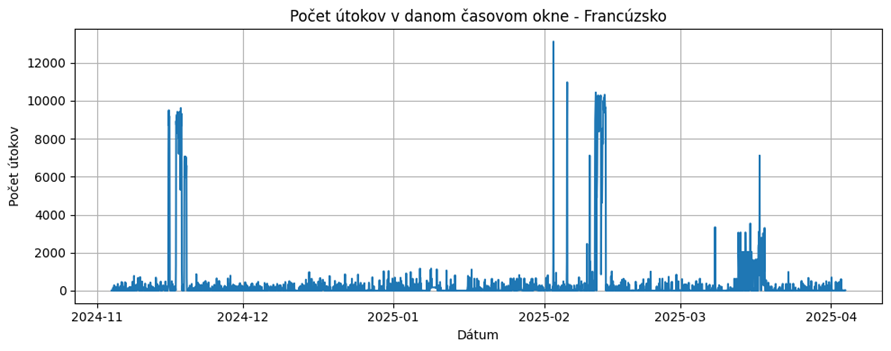
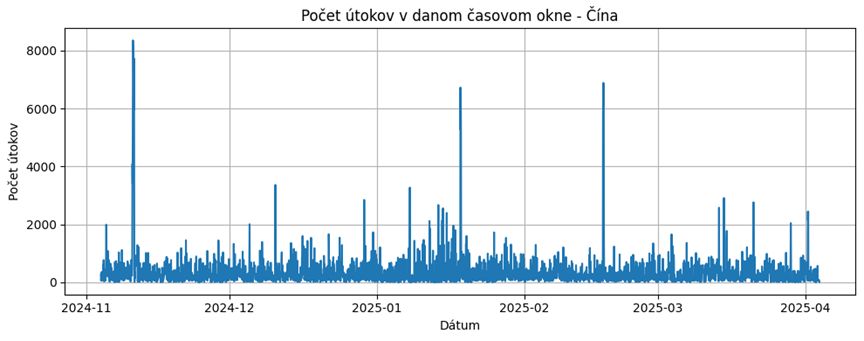
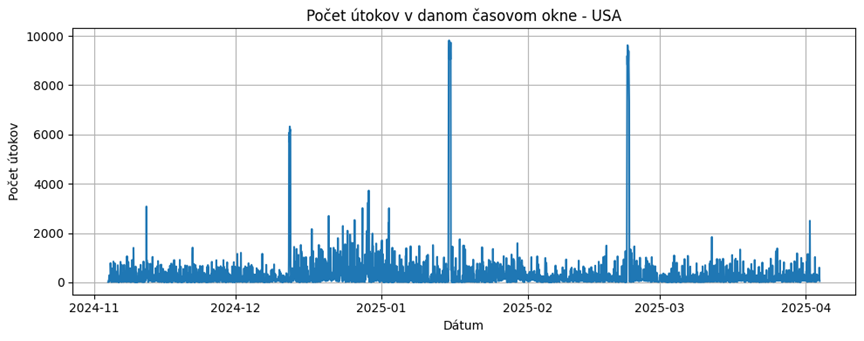
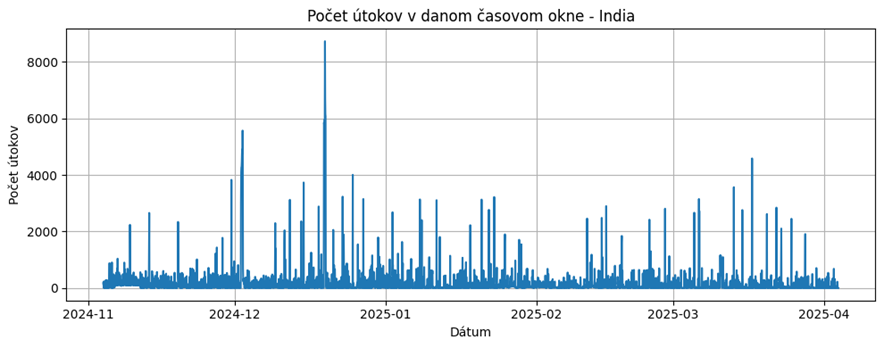
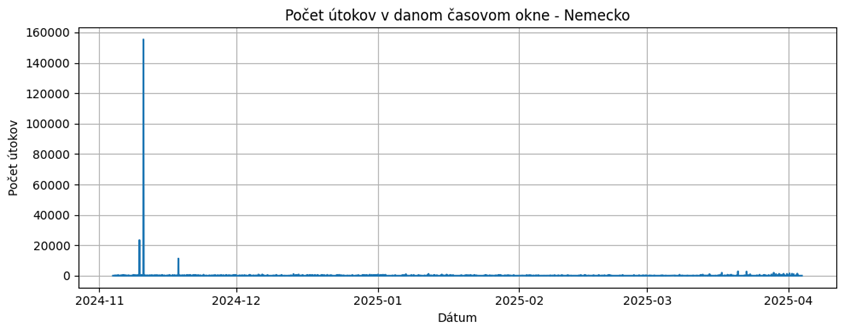
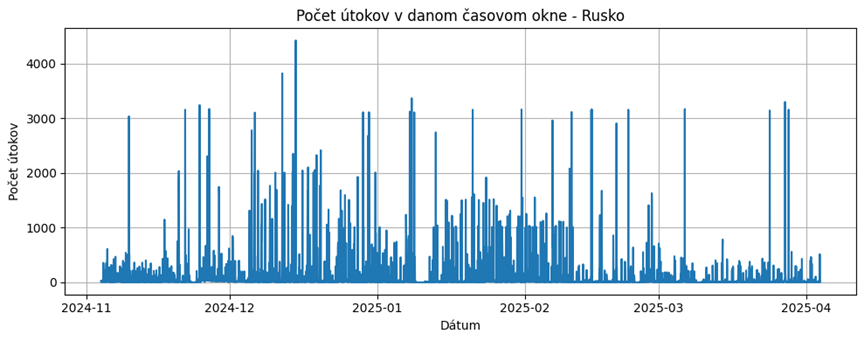
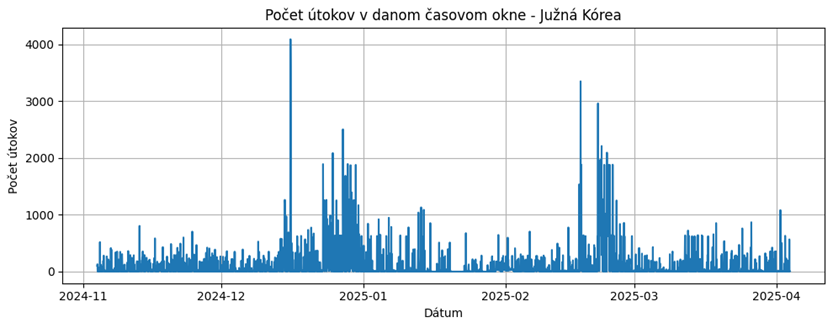
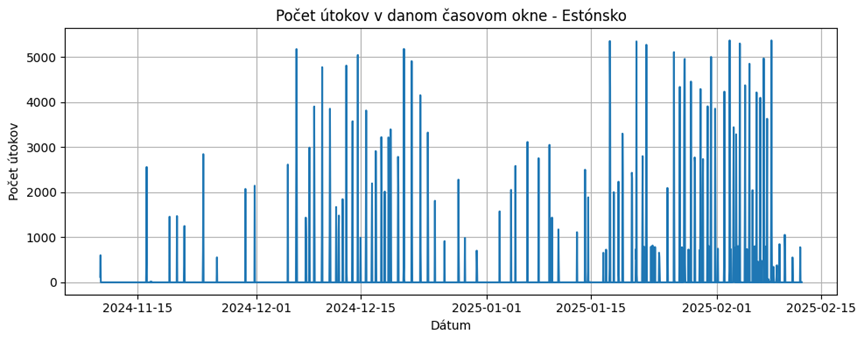
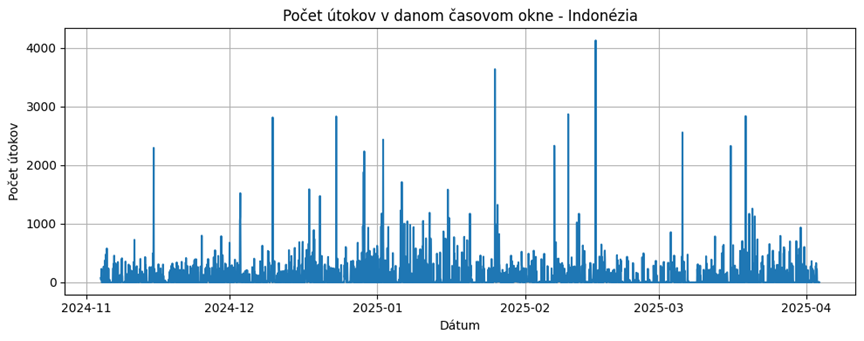
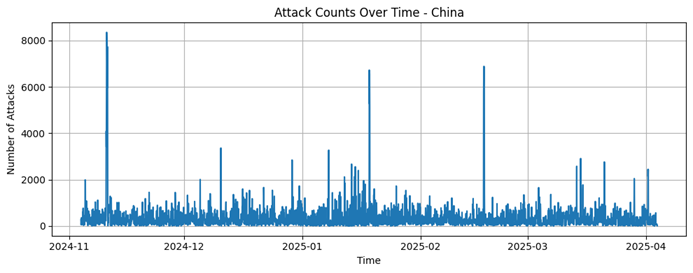
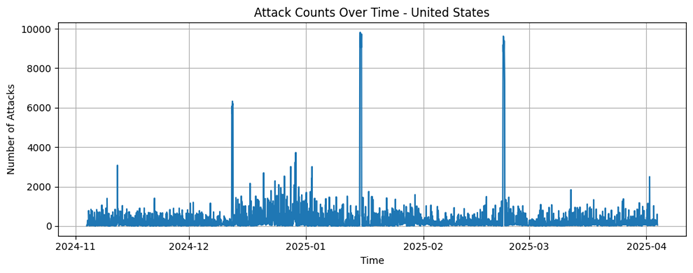
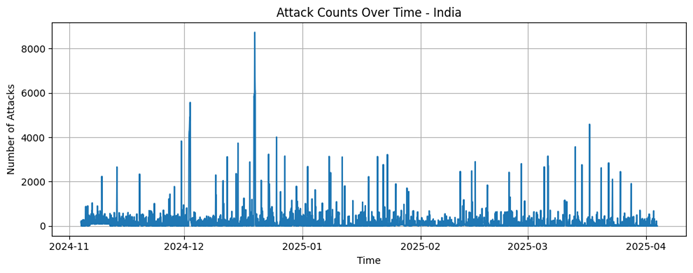
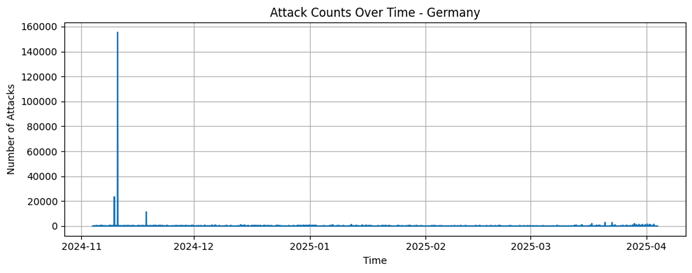
Number of attacks by country of origin
Dataset Information
Dataset Characteristics: Multidimensional
Domain: Cybersecurity
Flag Type: Date and time, Integer, Categorical
Number of Instances: 45577
Number of Flags: 3
Missing values: No
Time Range: 4.11.2024 – 3.4.2025
Data Source: Honeypots
Dataset Description
This dataset represents temporal data on the number of attacks and the number of unique IP addresses involved in attack attempts within specific time intervals.
Variables Table
| Variable name | Variable type | Missing data | Description |
|---|---|---|---|
|
Timestamp |
Date and time |
No |
Date and time of recording |
|
Attacks |
Integer |
No |
Number of attack attempts intercepted in a given time interval |
|
Country |
Categorical |
No |
Source country of attack |
Statistics
| Country | Count | Average | Standard deviation | Minimal value | Maximal value | Number of attacks by country |
|---|---|---|---|---|---|---|
|
China |
7213 |
162,83 |
303,2 |
1 |
4338 |
1174484 |
|
Estonia |
415 |
911,1 |
992,83 |
1 |
3102 |
378106 |
|
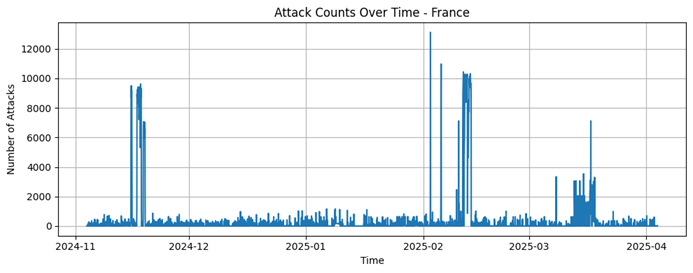
France |
3663 |
344,162 |
1002,54 |
1 |
7114 |
1260667 |
|
Germany |
4475 |
113,73 |
2734,02 |
1 |
155349 |
508930 |
|
India |
6285 |
108,55 |
304,95 |
1 |
4575 |
682237 |
|
Indonasia |
2850 |
125,46 |
213,01 |
1 |
3031 |
357563 |
|
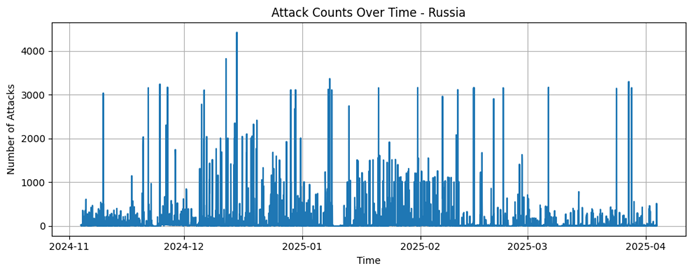
Russia |
5191 |
91,77 |
286,69 |
1 |
4417 |
476393 |
|
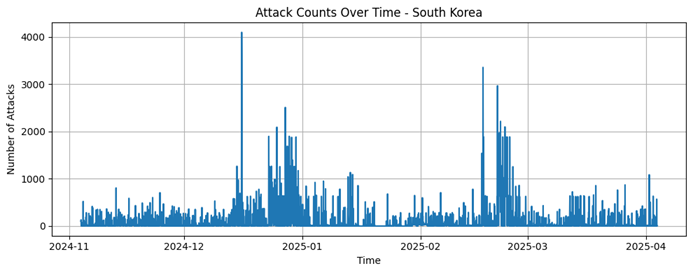
South Korea |
4046 |
99,6 |
219,45 |
1 |
2726 |
402975 |
|
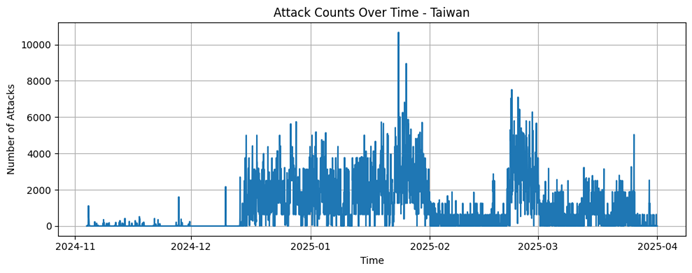
Taiwan |
4240 |
826,52 |
816,9 |
1 |
6289 |
3504450 |
|
United States |
7198 |
161,58 |
434,56 |
1 |
5190 |
1163085 |
Plots
Taiwan

France
China
United States
India
Germany
Russia
South Korea
Estonia
Indonasia
Honeynet data 2
1.6.2025 – 1.1.2026
More information
Honeypot Attacks
Dataset Information
Dataset Characteristics: Multidimensional
Domain: Cybersecurity
Flag Type: Date and Time, Integer
Number of Instances: 7248
Number of Flags: 7
Missing values: No
Time Range: 1.6.2025 – 1.1.2026
Data Source: Honeypots
Dataset Description
This dataset represents the number of attack attempts captured by various honeypot systems at different time intervals. Each row corresponds to a specific time period, and each flag records the number of attacks detected by a specific honeypot system.
Variables Table
| Variable name | Variable type | Missing data | Description |
|---|---|---|---|
|
Timestamp |
Date and time |
No |
Date and time of recording |
|
Attack_counts_Cowrie |
Integer |
No |
Number of attacks recorded by the Cowrie honeypot |
|
Attack_counts_Dionaea |
Integer |
No |
Number of attacks recorded by the Dionaea honeypot |
|
Attack_counts_Heralding |
Integer |
No |
Number of attacks recorded by the Heralding honeypot |
|
Attack_counts_Honeytrap |
Integer |
No |
Number of attacks recorded by the Honeytrap honeypot |
|
Attack_counts_Tanner |
Integer |
No |
Number of attacks recorded by the Tanner honeypot |
|
Attack_counts_Mailoney |
Integer |
No |
Number of attacks recorded by the Mailoney honeypot |
Statistics
| Attack_ counts_ Cowrie | Attack_ counts_ Dionaea | Attack_ counts_Heralding | Attack_ counts_ Honeytrap | Attack_ counts_ Tanner | Attack_ counts_ Mailoney | |
|---|---|---|---|---|---|---|
|
Count |
8544 |
8511 |
8540 |
8544 |
8544 |
8544 |
|
Average |
868,14 |
298,11 |
163,30 |
8,04 |
13,23 |
10,46 |
|
Standard deviation |
1052,86 |
974,82 |
503,52 |
142,98 |
245,35 |
29,25 |
|
Minimal value |
O |
O |
O |
O |
O |
O |
|
Maximal value |
21265 |
13186 |
2970 |
10306 |
18608 |
1213 |
Plots
Cowrie
Dionaea
Tanner
Honeytrap
Heralding
Mailoney
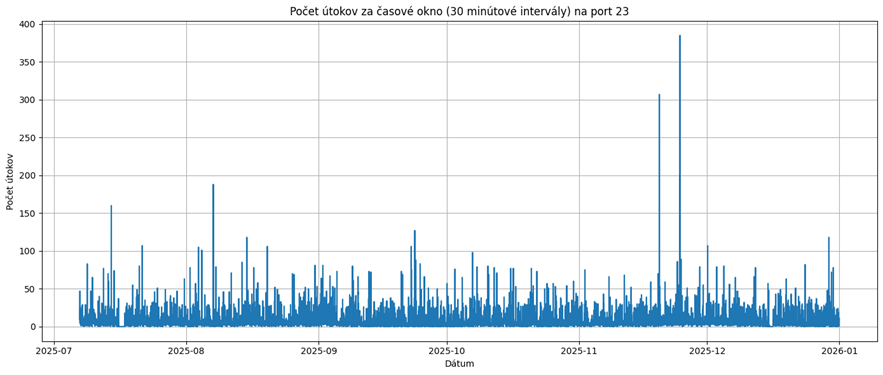
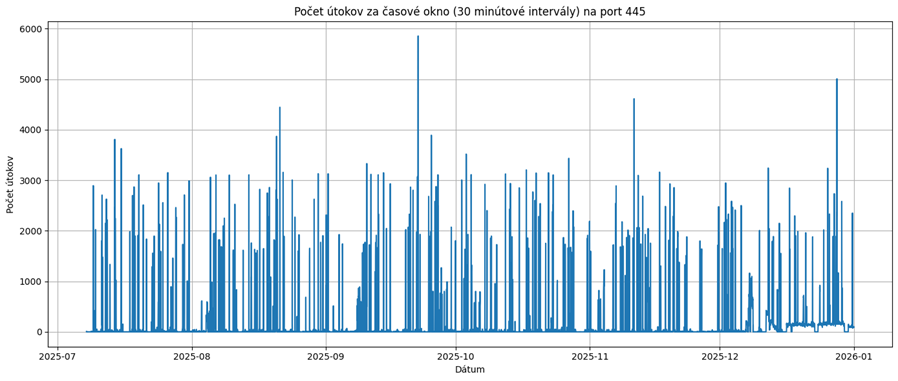
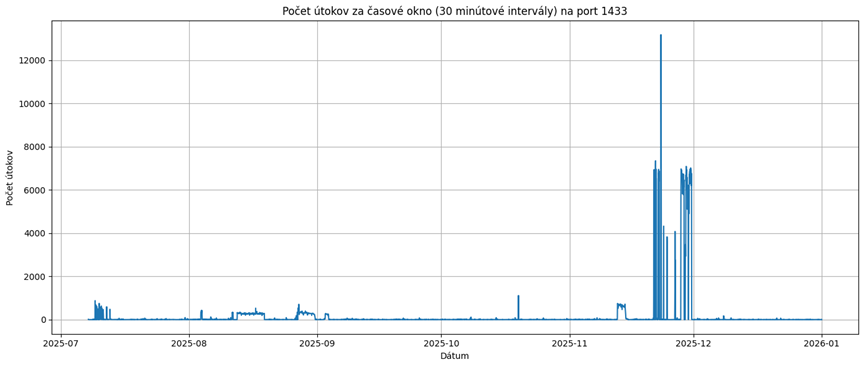
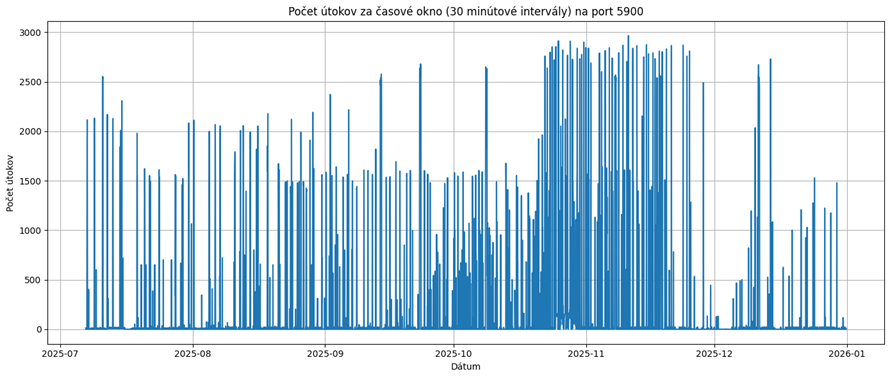
Attacks on Ports
Dataset Information
Dataset Characteristics: Multidimensional
Domain: Cybersecurity
Flag Type: Date and Time, Integer
Number of Instances: 7248
Number of Flags: 6
Missing values: No
Time Range: 1.6.2025 – 1.1.2026
Data Source: Honeypots
Dataset Description
This dataset contains time-lapse records of attack attempts captured by a honeypot monitoring system. Each row corresponds to a specific time period, and each flag represents the number of detected attacks on specific ports that are common targets for attackers.
Variables Table
| Variable name | Variable type | Missing data | Description |
|---|---|---|---|
|
Timestamp |
Date and time |
No |
Date and time of recording |
|
Attack_counts_22 |
Integer |
No |
Number of attacks on port 22 |
|
Attack_counts_23 |
Integer |
No |
Number of attacks on port 23 |
|
Attack_counts_445 |
Integer |
No |
Number of attacks on port 445 |
|
Attack_counts_1433 |
Integer |
No |
Number of attacks on port 1433 |
|
Attack_counts_5900 |
Integer |
No |
Number of attacks on port 5900 |
Statistics
| Attack_ counts_22 | Attack_ counts_23 | Attack_ counts_445 | Attack_ counts_1433 | Attack_ counts_5900 | |
|---|---|---|---|---|---|
|
Count |
8544 |
8544 |
8511 |
8511 |
8538 |
|
Average |
128,37 |
7,63 |
138,38 |
152,05 |
161,06 |
|
Standard deviation |
156,24 |
12,41 |
458,15 |
877,51 |
503,35 |
|
Minimal value |
O |
O |
O |
O |
O |
|
Maximal value |
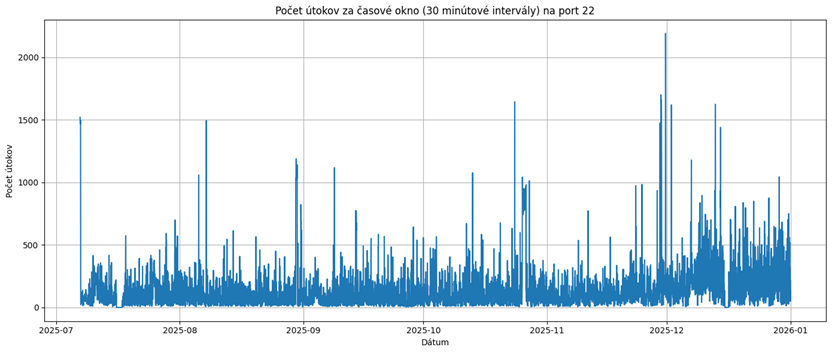
2191 |
385 |
5854 |
13178 |
2965 |
Plots
Target port 22
Target port 23
Target port 445
Target port 1433
Target port 5900
Number of all attacks and unique source IP addresses
Dataset Information
Dataset Characteristics: Multidimensional
Domain: Cybersecurity
Flag Type: Date and Time, Integer
Number of Instances: 7248
Number of Flags: 3
Missing values: No
Time Range: 1.6.2025 – 1.1.2026
Data Source: Honeypots
Dataset Description
This dataset represents temporal data on the number of attacks and the number of unique IP addresses involved in attack attempts within specific time intervals.
Variables Table
| Variable name | Variable type | Missing data | Description |
|---|---|---|---|
|
Timestamp |
Date and time |
No |
Date and time of recording |
|
Attack_counts |
Integer |
No |
Number of attack attempts intercepted in a given time interval |
|
Unique_ips |
Integer |
No |
Number of unique IP addresses involved in attack attempts |
Statistics
| Attack_counts | Unique_ips | |
|---|---|---|
|
Count |
8436 |
8436 |
|
Average |
1391,58 |
37,93 |
|
Standard deviation |
1586,18 |
14,23 |
|
Minimal value |
6 |
1 |
|
Maximal value |
22309 |
196 |
Plots
Number of attacks by country of origin
Dataset Information
Dataset Characteristics: Multidimensional
Domain: Cybersecurity
Flag Type: Date and time, Integer, Categorical
Number of Instances: 45577
Number of Flags: 3
Missing values: No
Time Range: 4.11.2024 – 3.4.2025
Data Source: Honeypots
Dataset Description
This dataset represents temporal data on the number of attacks and the number of unique IP addresses involved in attack attempts within specific time intervals.
Variables Table
| Variable name | Variable type | Missing data | Description |
|---|---|---|---|
|
Timestamp |
Date and time |
No |
Date and time of recording |
|
Attacks |
Integer |
No |
Number of attack attempts intercepted in a given time interval |
|
Country |
Categorical |
No |
Source country of attack |
Statistics
| Country | Count | Average | Standard deviation | Minimal value | Maximal value | Number of attacks by country |
|---|---|---|---|---|---|---|
|
China |
7494 |
101,15 |
231,51 |
1 |
3815 |
758055 |
|
France |
2930 |
396,01 |
1553.62 |
1 |
13370 |
1160298 |
|
Germany |
6378 |
61,39 |
298,09 |
1 |
8102 |
391570 |
|
India |
4588 |
90.97 |
249,00 |
1 |
3492 |
472175 |
|
Indonasia |
3809 |
123,96 |
223,39 |
1 |
2853 |
472175 |
|
Russia |
7996 |
72,42 |
213,02 |
1 |
3170 |
579038 |
|
Singapur |
3555 |
120,79 |
384,38 |
1 |
14970 |
429419 |
|
Holandsko |
7771 |
169,06 |
425.26 |
1 |
14437 |
1313752 |
|
United States |
8396 |
182,52 |
367,48 |
1 |
3781 |
1532402 |
|
Vietnam |
2880 |
146,88 |
495,56 |
1 |
5690 |
423002 |
Plots
United States
Holandsko
France
China
Russia
Indonasia
Singapur
Vietnam
India